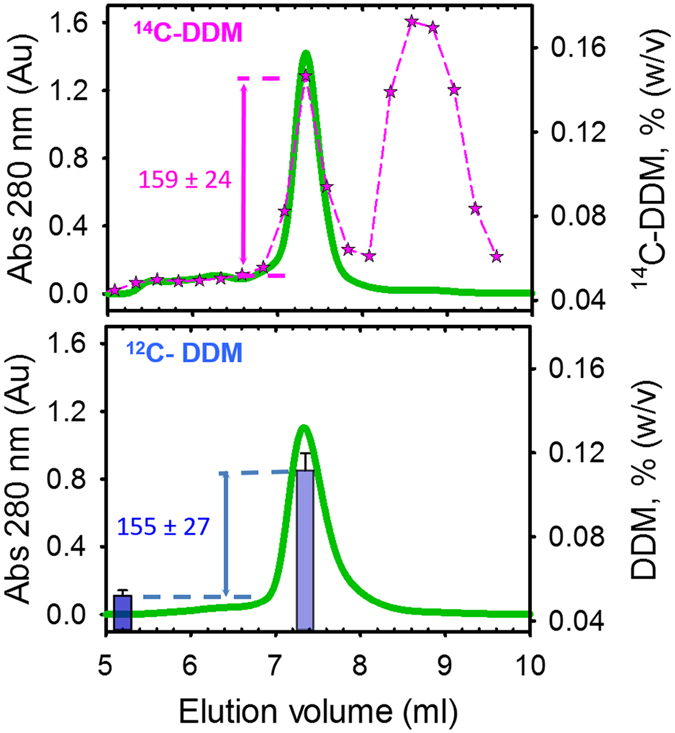
Figure 3. Compared quantification of DDM bound to the SERCA1a Ca2+-ATPase.

The protein was extracted with radiolabeled (upper panel) or cold (lower panel) DDM and then submitted to two successive SEC. Green traces correspond to the absorbance at 280 nm. 14C-DDM was quantified by liquid scintillation (pink stars) and 12C-DDM by MALDI-TOF MS (blue bars). Quantifications were done in triplicate on the same experiment.
