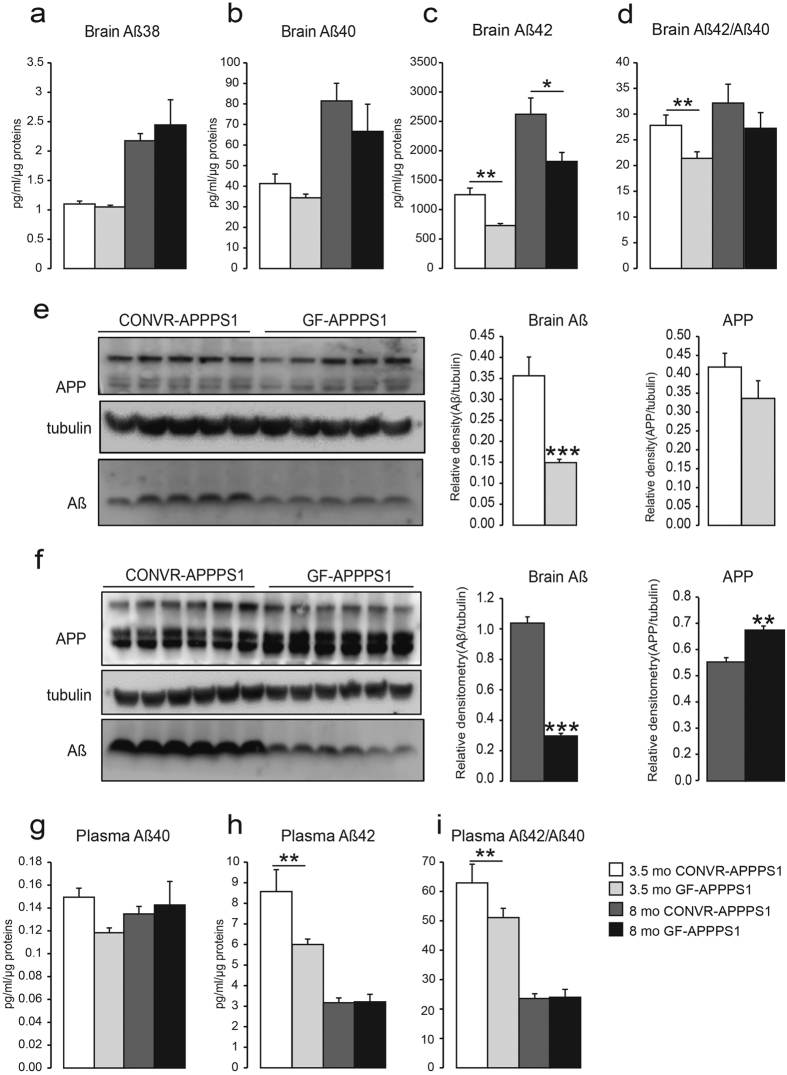
Figure 2. Reduction of Aβ levels in brain and blood of GF-APPPS1 transgenic mice.
(a–d) Levels of Aβ38, Aβ40, Aβ42 and Aβ42/Aβ40 ratio measured by ELISA in 3.5 and 8 month-old conventionally-raised (CONVR-APPPS1) and germ-free APPPS1 mice (GF-APPPS1). Levels of Aβ assessed by western blot in 3.5 month-old (n = 5) (e) and in 8 month-old mice (n = 6). Full blots are shown in Supplementary Fig. 6 (f). Plasmatic levels of soluble Aβ40 (g), Aβ42 (h) and ratio Aβ42/Aβ40 (i) by ELISA. Experiments were performed three times, and data represent mean values of a representative experiment. Data represent mean ± SEM. Statistical differences between germ free and conventionally-raised mice: *p < 0.05, **p < 0.01, ***p < 0.001.

