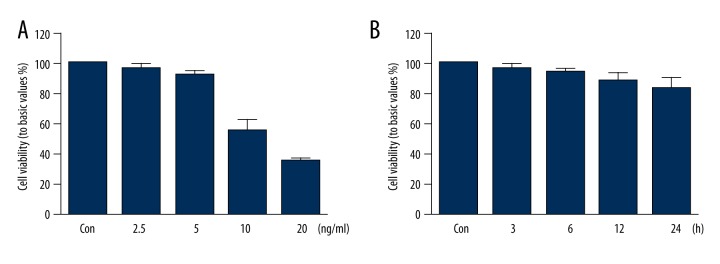
Figure 1.
Effect of allicin on HUVEC viability: (A) HUVECs incubated with different concentrations of allicin (2.5, 5, 10, and 20 ng/mL) for 12 h; (B) HUVECs treated with 5 ng/mL allicin at different times (0, 3, 6, 12, and 24 h). Cell viability detected by thiazole blue chromatometry. Data derived from 3 different experiments and presented in mean ±SD (n=3); * P<0.05 compared with the control group.

