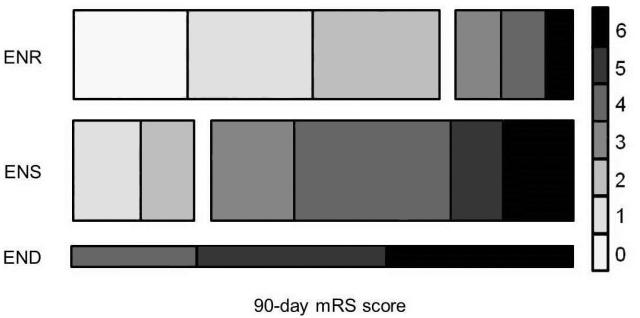
Figure 1.
Distribution of 90-day modified Rankin Scale (mRS) scores for patients with early neurological recovery (ENR), stability (ENS), and deterioration (END). The right-hand key represents each category of mRS as labeled. The height of each bar represents the proportion of the cohort exhibiting each course of neurological deficit evolution (ENR: 41%, ENS: 48%, END: 11%).

