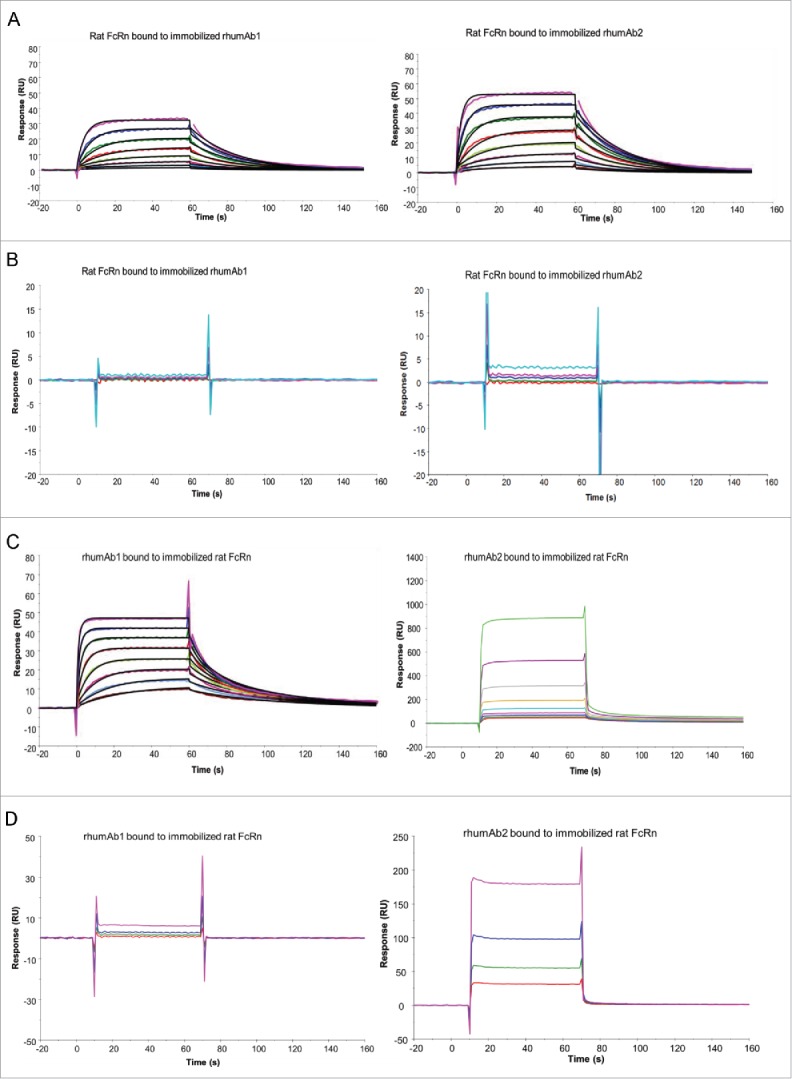
Figure 1.

Representative sensorgrams of rhumAbs binding to recombinant rat FcRn on 2 Biacore assay formats. (A) recombinant rat FcRn bound to immobilized rhumAbs on format 1 at pH = 6.0, and (B) at pH = 7.4; (C) rhumAbs bound to immobilized recombinant rat FcRn on format 2 at pH = 6.0, and (D) at pH = 7.4. The experimental data are represented by colored lines. On format 1, at pH 6.0, concentrations of rat FcRn (from bottom to top) are 0.078, 0.156, 0.313, 0.625, 1.25, 2.5, 5, and 10 µM. The black lines are fitted data using the kinetic monovalent binding model. At pH 7.4 concentrations of tested rat FcRn (from bottom to top) are 2.5, 5, 10, and 20 µM. On format 2, concentrations of rhumAbs (from bottom to top) are 0.039, 0.078, 0.156, 0.313, 0.625, 1.25, 2.5, and 5 µM. The black lines are fitted data using the kinetic bivalent binding model. At pH 7.4 concentrations of rhumAbs (from bottom to top) are 1.25, 2.5, 5, and 10 µM. The sensorgrams were generated after in-line reference cell correction followed by buffer sample subtraction. The experiments were conducted using running buffer containing PBS, 0.05% polysorbate 20, pH 6.0 or pH 7.4.
