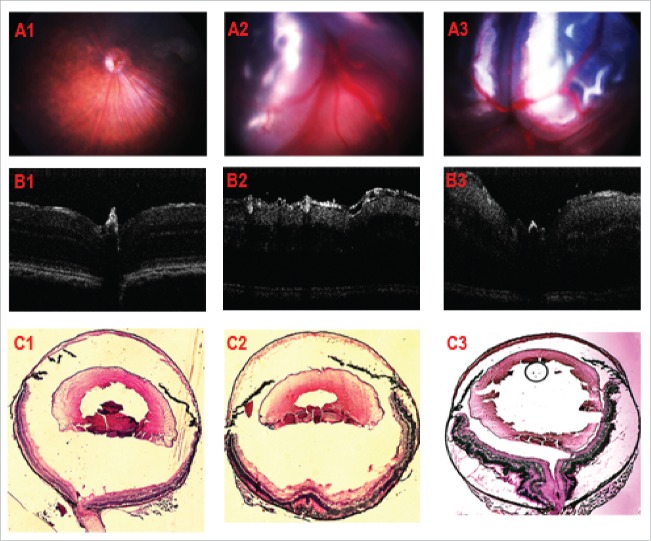
Figure 8.
Typical images of the simplified RD grading in tet-opsin/huVEGF-A double transgenic mice. Fundus images with A1, A2, A3 representing NRD, PRD, TRD respectively; OCT images with B1, B2, B3 representing NRD, PRD, TRD respectively; Ocular cryo-section with H&E stain, C1, C2, C3 represent NRD, PRD, TRD respectively.

