Figure 1.

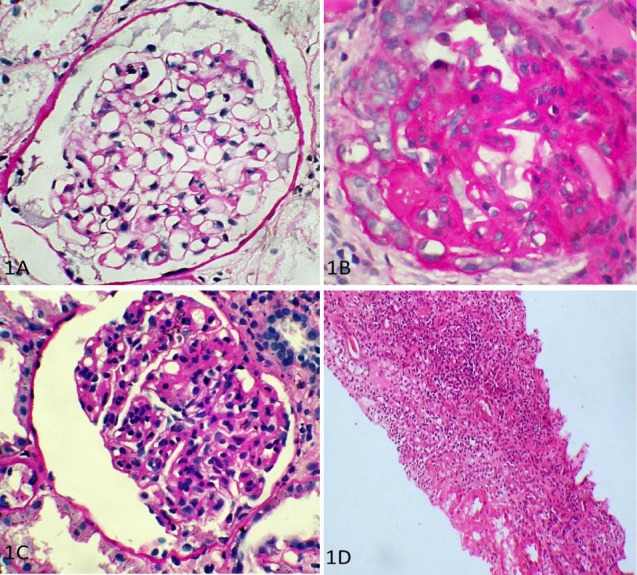
Spectrum of lesions according to Oxford classification for IgA nephropathy. (A) M0 E0 S0 (PAS stain, ×400); (B) M1 E1 S1 (PAS stain, ×400); (C) M0 E1 S0 (PAS stain, x400); (D) T2 lesion (H and E, ×100).

Spectrum of lesions according to Oxford classification for IgA nephropathy. (A) M0 E0 S0 (PAS stain, ×400); (B) M1 E1 S1 (PAS stain, ×400); (C) M0 E1 S0 (PAS stain, x400); (D) T2 lesion (H and E, ×100).