
Figure 1.
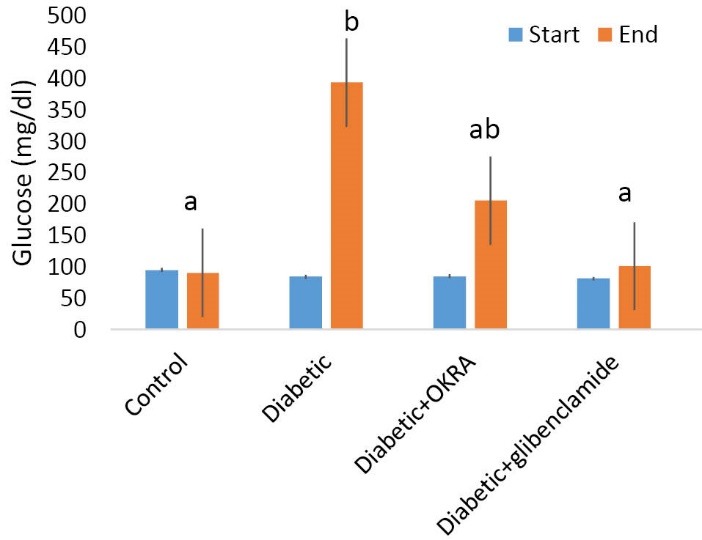
Comparison of blood glucose in investigated groups. The results are stated as mean ± SE (n = 10). a P < 0.05 in comparison to the related control group at the same time. b P < 0.05 at the end of period compared to beginning of period
Official websites use .gov
A
.gov website belongs to an official
government organization in the United States.
Secure .gov websites use HTTPS
A lock (
) or https:// means you've safely
connected to the .gov website. Share sensitive
information only on official, secure websites.
Comparison of blood glucose in investigated groups. The results are stated as mean ± SE (n = 10). a P < 0.05 in comparison to the related control group at the same time. b P < 0.05 at the end of period compared to beginning of period