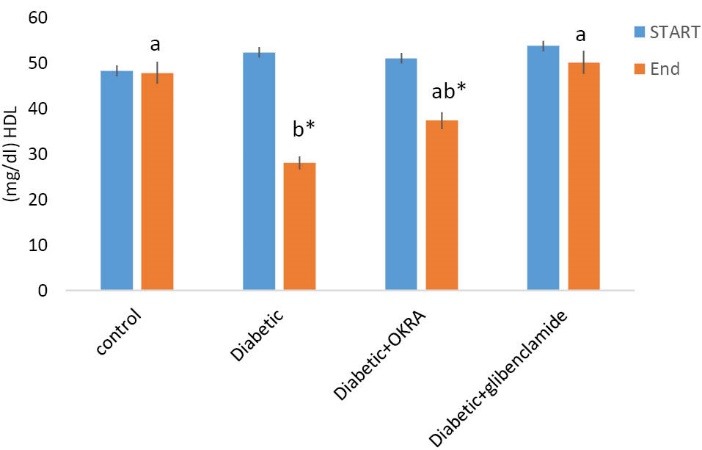
Figure 4.

Comparison of HDL serum in investigated groups. The results are shown as Mean ± SE (n = 10). a P < 0.05 in comparison to the related diabetic control group at the same time. b P < 0.05 at the end of the period compared to the early period. * P < 0.05 in comparison to glibenclimide at the same time.
