
Figure 5.
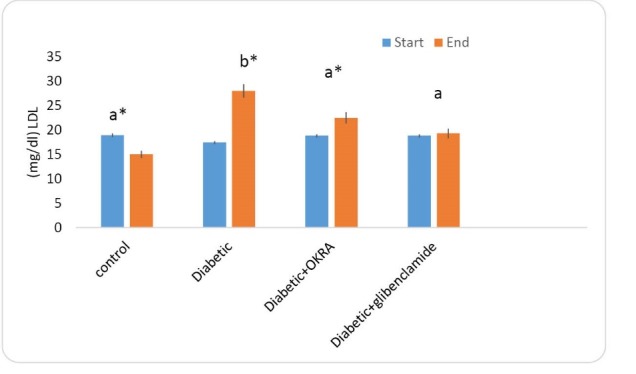
Comparison of serum LDL-C in the investigated groups. a P < 0.05 in comparison to the related diabetic control group at the same time. b P < 0.05 at the end of the period compared to the beginning of the period. * P < 0.05 in comparison to glibenclimide group at the same time.