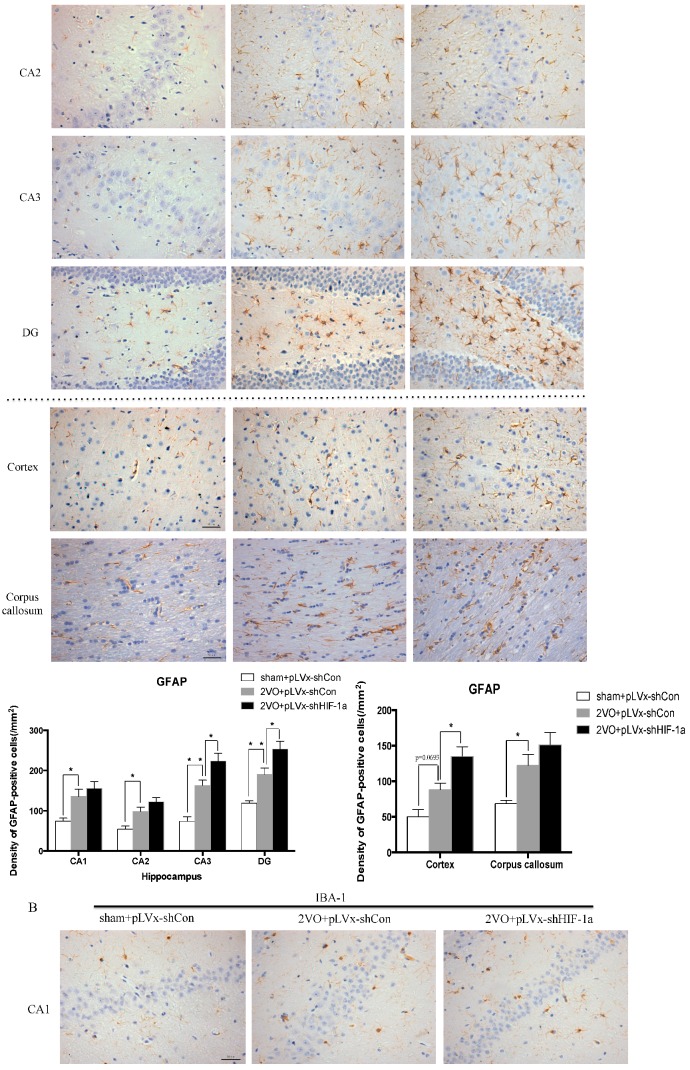
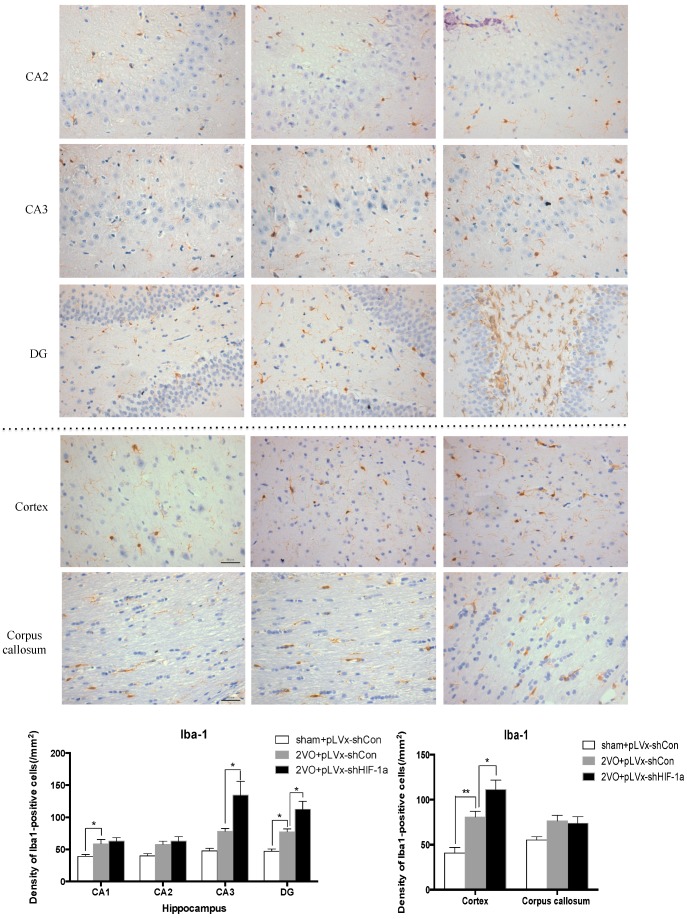
Figure 6.
The effects of HIF-1α knockdown on CCH-induced glial activation. Representative photomicrographs of glial fibrillary acidic protein (GFAP) (A) and Iba-1 (B) immunohistochemistry in cortex, corpus callosum, and four subregions of the hippocampus four weeks after sham or 2VO surgery with or without HIF-1α-knockdown treatment. The positive cells are dyed brown. Bar = 50 µm (the magnification of all images is consistent). The Histograms showing the densities of the cells that were immunoreactive for GFAP (A) and Iba-1 (B) (per mm2). The bars represent the mean ± SEM (n = 8). * p < 0.05, ** p < 0.01 (One-way ANOVA followed by Bonferroni post hoc tests).


