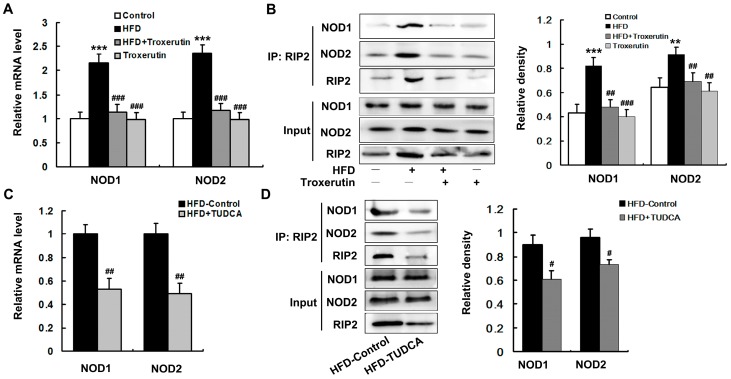
Figure 6.
Troxerutin depresses NOD activation in HFD-treated mouse livers (n = 3). (A,C) show the mRNA levels of NOD1 and NOD2 in mouse livers; (B,D) show the immunoblotting and densitometry of NOD1 and NOD2 after immunoprecipitation, using RIP2 antibody in mouse livers. All of the values are expressed as the mean ± SD. ** p < 0.01, *** p < 0.001 vs. the control group; # p < 0.05, ## p < 0.01, ### p < 0.001 vs. the HFD group.

