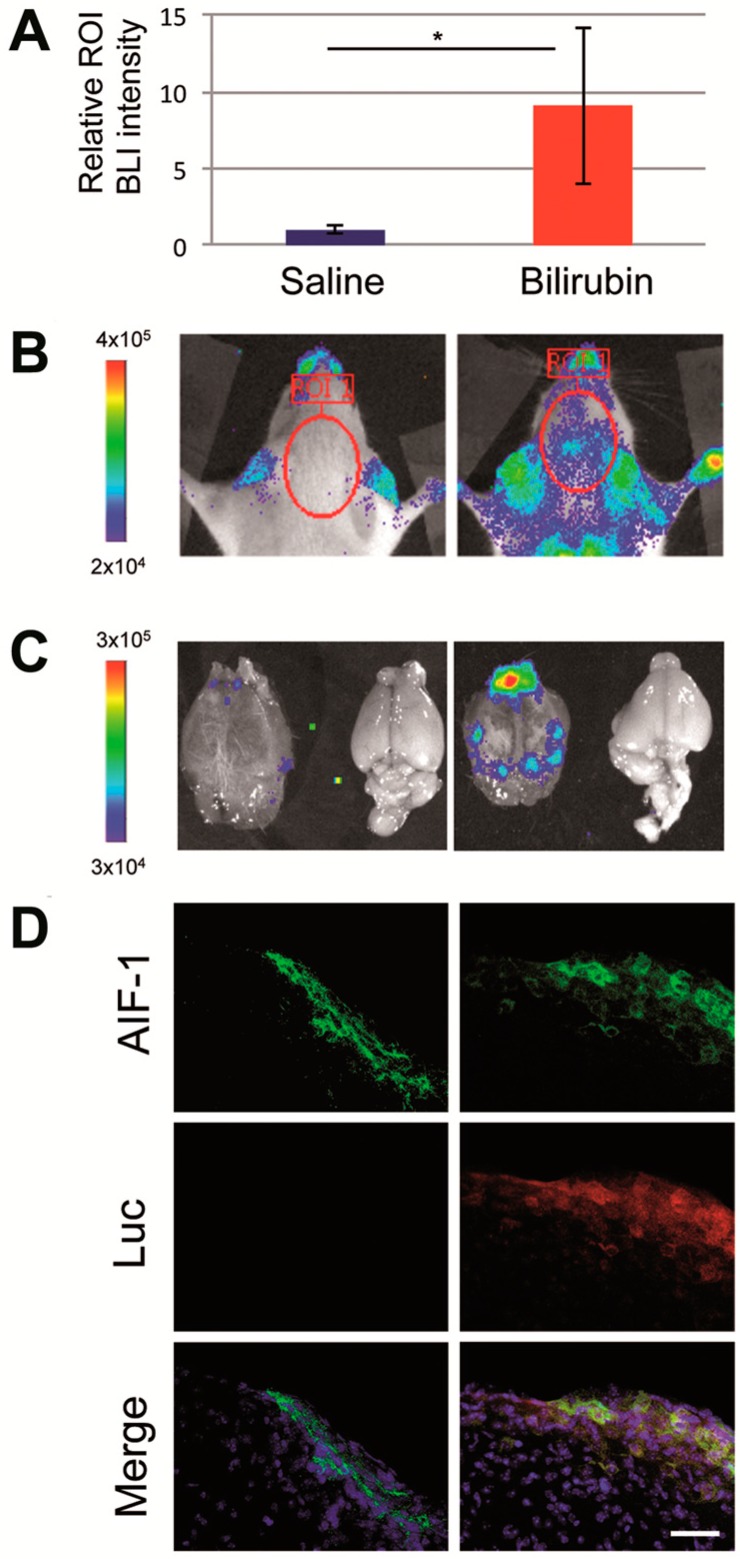
Figure 3.
Effects of intra peritoneal injection of bilirubin into MITO-Luc mice. Representative MITO-Luc mouse (n = 5 per group) receiving saline solution or bilirubin (50 mg/kg) were analyzed 1 day after administration. (A) Relative bioluminescence intensity assessed by Living Imaging software; the asterisk (*) indicates a significant difference versus the control group (p ≤ 0.05); (B) bioluminescence imaging (BLI) of live animals; (C) BLI imaging of brain after necropsy. The color scale next to the images indicates radiance, with red and blue respectively representing the highest and lowest bioluminescent signals, expressed in photons/s/cm2/sr; (D) Representative immunohistochemical images of lateral sagittal brain sections including middbrain and substantia nigra from saline- (left panels) and bilirubin-treated mice (right panels), stained with antibodies anti-allograft inflammatory factor 1 (AIF-1, green), antibodies anti-luciferase (Luc, red), and relative merged images with 4′,6-diamidino-2-phenylindole (DAPI, blue) staining. Scale bar: 100 µm.

