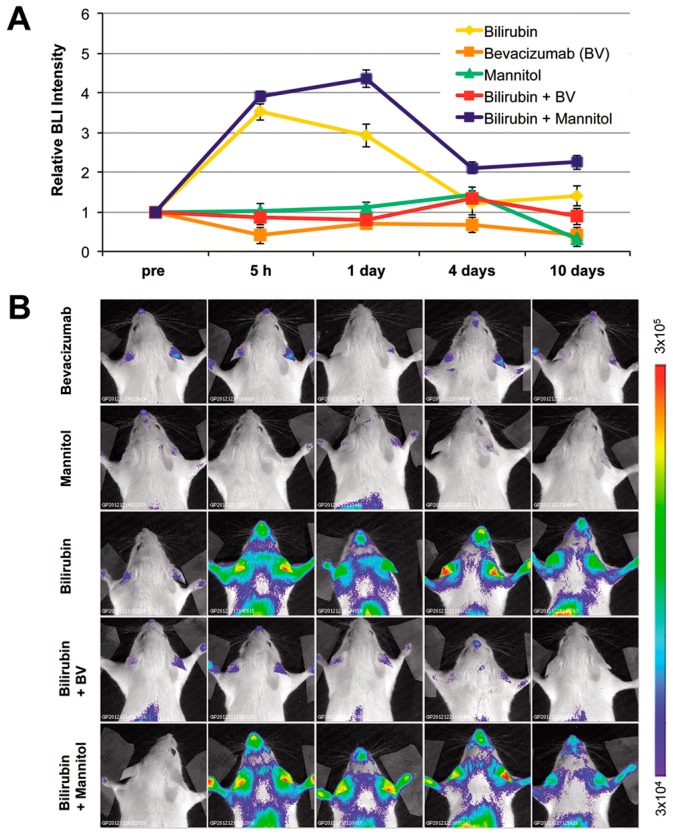
Figure 5.
Effect of alteration of blood–brain barrier permeability. Before bilirubin administration, MITO-Luc mice were pretreated with mannitol (3 mL of 25% mannitol/100 g body weight) or bevacizumab (25 mg/kg body weight) and bioluminescence imaging analysis (BLI) was performed at different time points. (A) Quantification of BLI signals in selected regions of interest in the brain area. Statistical analysis revealed significant differences (p ≤ 0.05) of the bilirubin group vs. bilirubin + bevacizumab group at the 5 h and 1 day time points; (B) BLI analysis of one representative animal out of five per group, at the different time points. The color bar and numbers illustrate the relative bioluminescent signal intensities from the lowest (blue) to the highest (red), with minimal and maximal values expressed in photons/s/cm2/sr.

