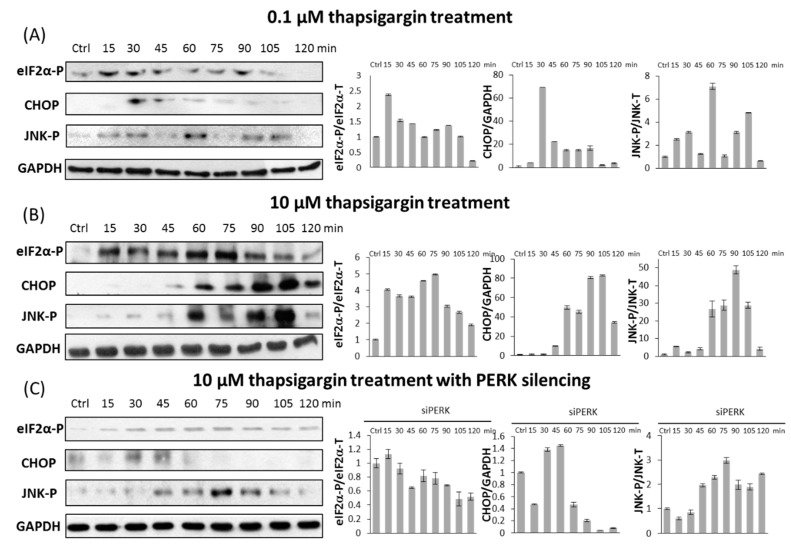
Figure 5.
Kinetics of apoptosis inducers with respect to ER stress. HEK293T cells were treated with (A) low level of TG (0.1 µM); (B) high level of TG (10 µM); and (C) high level of TG (10 µM) combined with PERK silencing. The expression level of eiF2α-P, CHOP and JNK-P markers were followed in every 15 min for 2 h by immunoblotting. GAPDH was used as a housekeeping gene. Immunoblot results (left panel) and their densitometry data (right panel) are depicted. The intensity of CHOP is normalized for GAPDH, eiF2α-P is normalized for total level of eiF2α and JNK-P is normalized for total level of JNK. The total level of eiF2α and JNK-P are not shown. Three parallel experiments were carried out (errors bars represent standard deviation).

