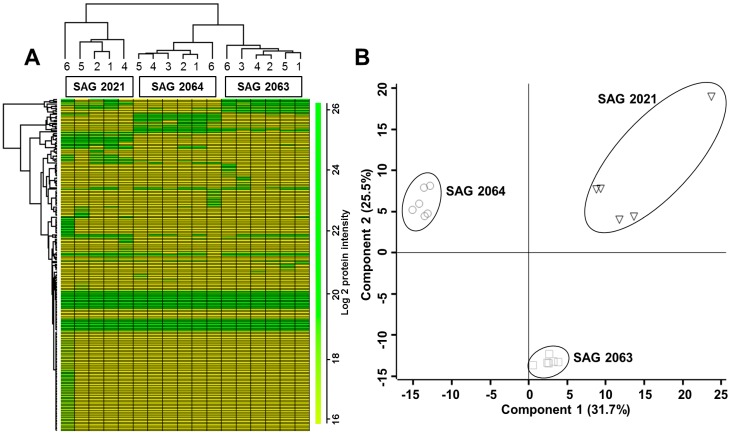
Figure 1.
(A) Heat map shows the unsupervised hierarchical clustering of proteins from SAG 2021, SAG 2063 and SAG 2064 and all six replicates are clustered together. The log10 value of the MS signal intensity is shown; (B) Principal component analysis of logarithmized values without z-scoring indicating the strains used for the analysis.

