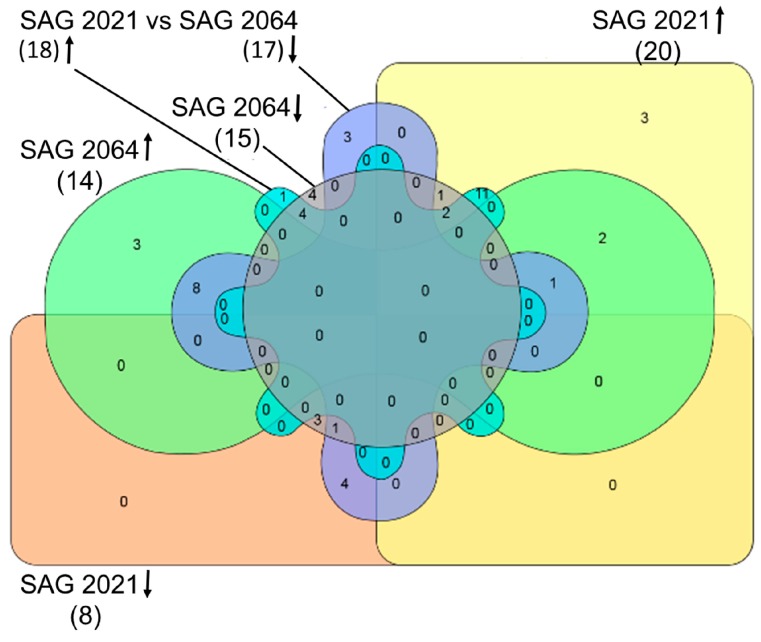
Figure 2.
Venn diagram created using InteractiVenn, a web-based tool to compare the accession numbers of proteins identified. Total number of proteins is listed within the parenthesis, up- and down-arrows indicate up- and down-regulated proteins, respectively. Colour codes: yellow-SAG 2021 up-regulated, orange-SAG 2021 down-regulated, green-SAG 2064 up-regulated, purple-SAG 2064 down-regulated, blue-SAG 2021 up-regulated and grey SAG 2064 down-regulated.

