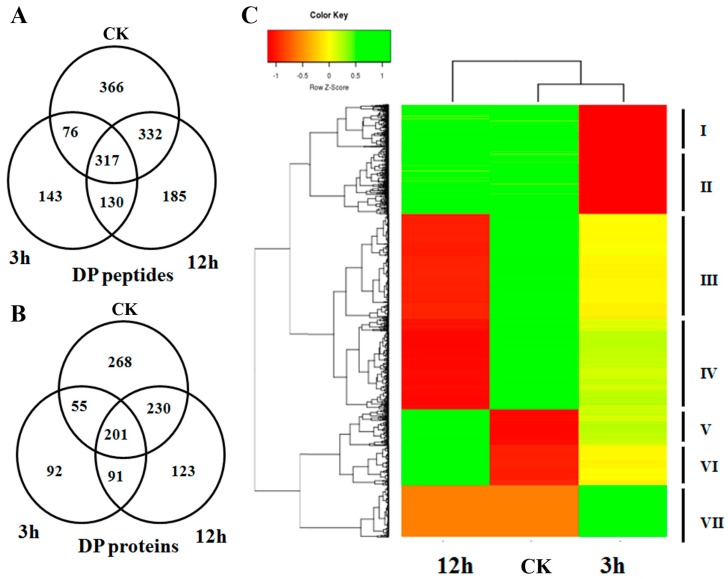
Figure 2.
(A) Venn diagram showing the number of differentially phosphorylated (DP) phosphopeptides identified in control (CK), 3 and 12 h; (B) Venn diagram showing the number of DP phosphoproteins identified in CK, 3 and 12 h; (C) Hierarchical clustering analysis of the DP proteins among CK, 3 and 12 h. Color bar on the left represents the log2 phosphorylation intensity values. Red, yellow and green indicate the low, medium and high phosphorylation intensity values respectively.

