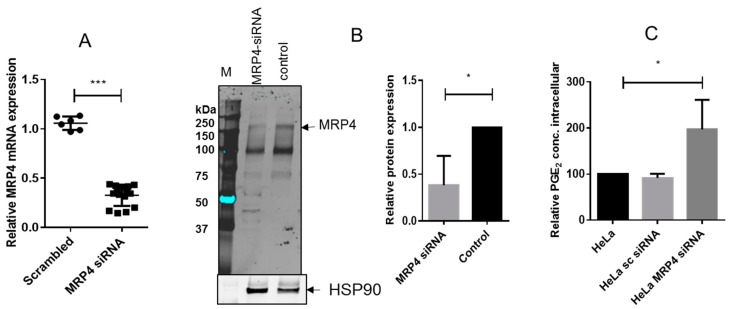
Figure 5.
(A) MRP4 mRNA expression in HeLa cells after transfection of scrambled or MRP4 siRNA. Means ± S.E.M. of three independent experiments, determined in triplicate, are shown. Statistical analysis was done with t-test; (B) Western blot analysis of MRP4 in MRP4 siRNA-treated HeLa cells and control cells: HSP90 was used as the loading control. One representative experiment out of three is shown, as well as the quantification of the three Western blots (MRP4/HSP90). Means ± S.E.M. of three independent experiments. Statistical analysis was done with t-test; (C) Intracellular PGE2 concentrations of stimulated HeLa cells after MRP4 siRNA treatment. HeLa cells were transfected with MRP4 siRNA or scrambled siRNA, and 24 h later stimulated with IL-1β (1 ng/mL) and TNFα (5 ng/mL) for 16 h. Intracellular PGE2 was determined by nano-LC-MS/MS. Means ± S.E.M. of three experiments. Statistical analysis was done with one-way ANOVA. Significant p values are shown as: *** p ≤ 0.001, * p ≤ 0.05.

