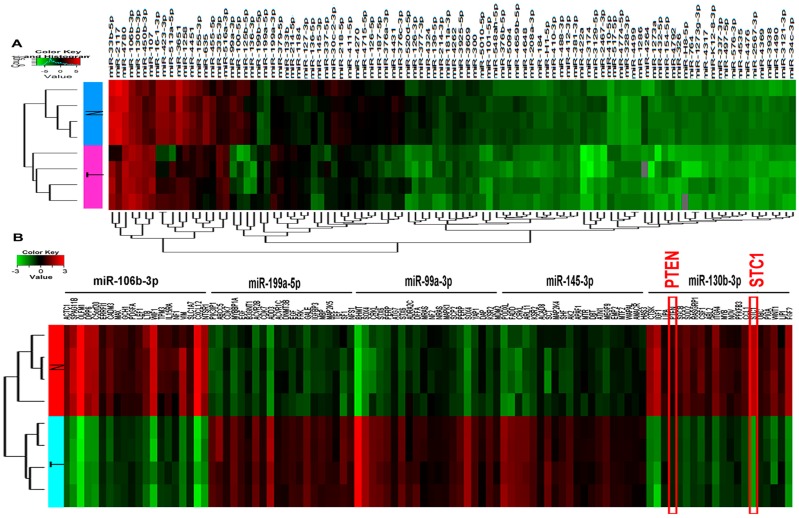
Figure 1.
Heat maps show expression profiles of miRNAs and co-expressed target mRNAs. Each row represents a sample and each column represents a miRNAs or mRNA. The red strip represents high relative expression and the green strip represents low relative expression. T represents the bladder cancer group, and N represents the normal control group. Each group contains four different samples. (A) Heat map of differentially expressed miRNAs (fold change ≥ 1.5 and p-value < 0.05); and (B) Heat map of co-expressed target mRNAs from the two most up- and the three most down-regulated miRNAs.

