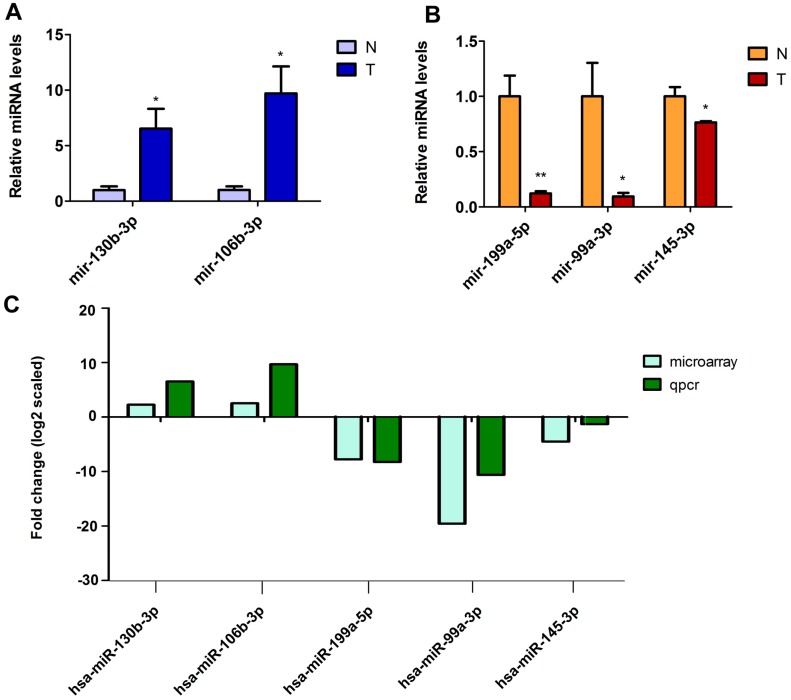
Figure 3.
The differentially expressed miRNAs are validated in bladder carcinoma by quantitative RT-PCR. (A,B) The relative expression levels of the five miRNAs are shown in thirty pairs of tumor tissues (T) and normal tissues (N). Data are shown as mean ± SEM. * p < 0.05, ** p < 0.01, n = 30; and (C) The comparison between qPCR results and microarray data. The heights of the columns represent the fold changes (log2 transformed) computed from qPCR and microarray data respectively.

