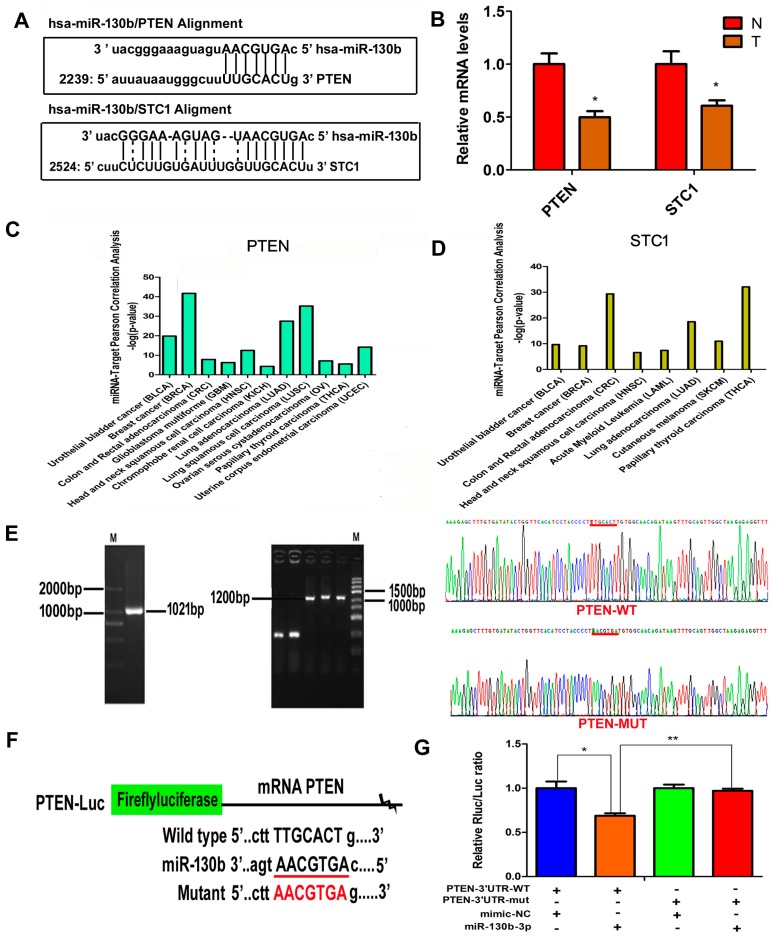
Figure 5.
Targets of miR-130b-3p are identified. (A) The putative binding sites between miR-130b-3p and PTEN 3′-UTR or stanniocalcin 1 (STC1) 3′-UTR; (B) The relative expression levels of PTEN and STC1 in thirty pairs of tumor tissues (T) and normal tissues (N). Data are shown as mean ± SEM. * p < 0.05, n = 30; (C,D) miR-130b/target PTEN or STC1-cancers Pearson correlation analysis according to starbase function prediction; and (E–G) Luciferase activity in 293T cells co-transfected miR-130b-3p with luciferase reporters containing PTEN 3′-UTR or mutant. Data are presented as the relative ratio of Renilla luciferase activity to fireflyluciferase activity. n = 3, mean ± SD. * p < 0.05, ** p < 0.01. The red lines in the Figure 5E,F are the binding site and mutation site of PTEN binding to miR-130b-3p. The red character in the Figure 5F is the mutation sequence.

