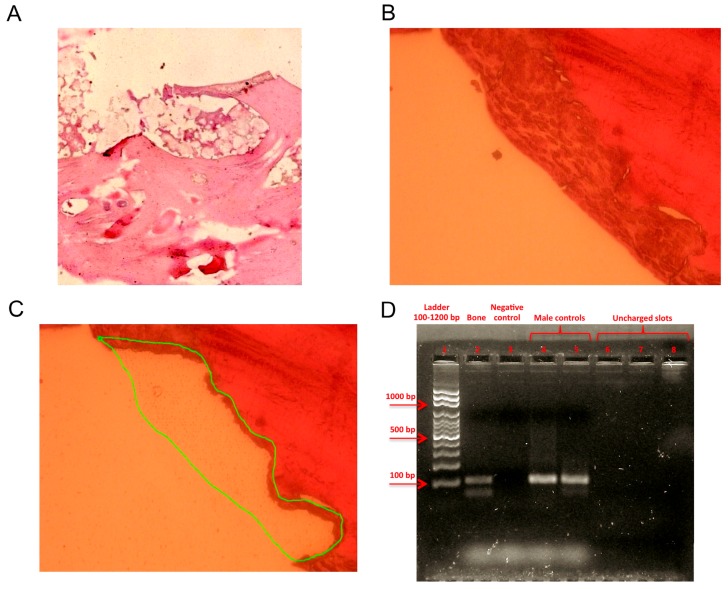
Figure 1.
Bone sample characterization. (A) Microscopy image (hematoxylin and eosin staining) showing the features typical of bone tissue and inflammatory infiltration; example of a laser captured microdissected area of the bone sample: (B) shows the pre-microdissected area (40× resolution); (C) the green line encircles the microdissected area; (D) sex-determining region Y amplification revealed the sex of the patient: lane 1: ladder (100–1200 bp); lane 2: sample; lane 3: negative control; lanes 4 and 5: male controls; lanes 6–8: uncharged slots.

