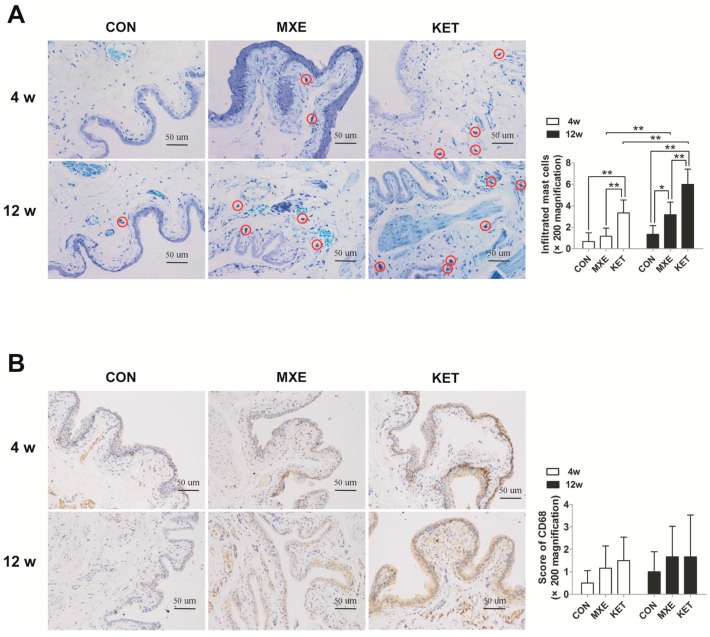
Figure 5.
Mast cell and macrophage infiltration in rat bladder tissue after MXE and KET treatment. Representative graphs of toluidine blue-stained mast cells (A); and CD68 positive macrophages (B) in the three groups (n = 6 in each group). Magnification: ×200; Scale bar: 50 μm. Mast cell and macrophage infiltration was greater and tended to increase with drug exposure time in the MXE and KET groups (red circles indicate mast cells). Data were analyzed with two-way. * p < 0.05, ** p < 0.01.

