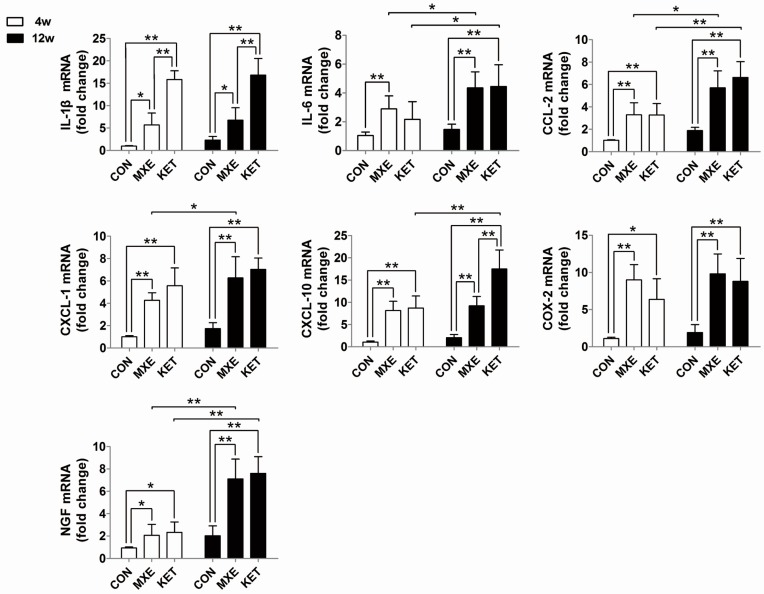
Figure 6.
Relative levels of cytokine/chemokine gene expression of rats. The qRT-PCR analysis results for IL-1β, IL-6, CCL-2, CXCL-1, CXCL-10, COX-2, and NGF in bladder tissue of normal saline, methoxetamine and ketamine treated rats (n = 6 in each group). Data are expressed in mean ± SD, as the fold-change vs. the mean value in the control group at four weeks. Two-way ANOVA were used for analysis. * p < 0.05, ** p < 0.01.

