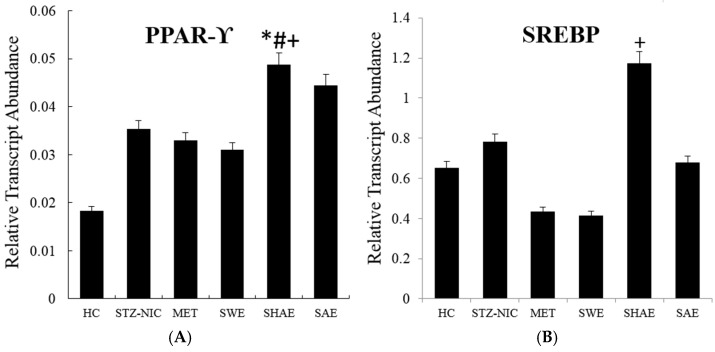
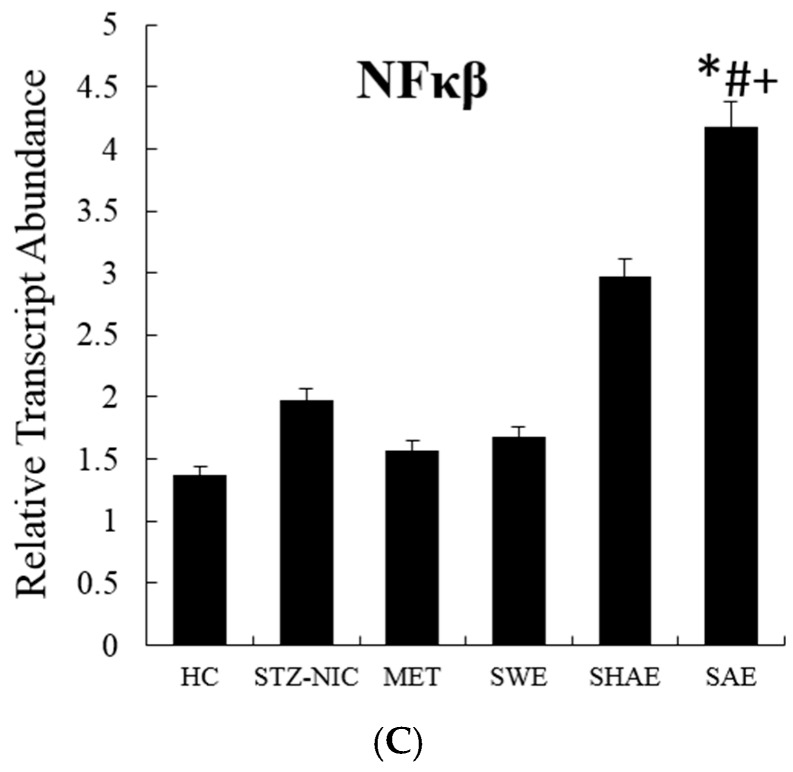
Figure 2.
Expression profile of transcription factors from the liver. Animals from the SWE, SHAE, and SAE groups were treated daily with corresponding extracts at a dose of 2 g/kg body weight (Per os). A, B and C are expression profiles of the PPAR-γ, SREBP and NF-κβ genes, respectively. RNA was isolated from the animals’ livers and cDNA was prepared. cDNA was analyzed for the modulation of transcription factors of fatty acid metabolism genes. Results are represented as mean ± SE (n = 3 for each group and the reactions were performed in duplicate). Comparisons between the control group and each individual group were performed by Dunnett’s multiple comparison test. (* p ≤ 0.05, when compared with the healthy control group; # p ≤ 0.05, when compared with the NIC-STZ control group; + p ≤ 0.05, when compared with the MET-treated control group). HC: Healthy control, NIC-STZ: NIC-STZ treated control, MET: Metformin-treated control, SWE: Strawberry aqueous extract, SHAE: Strawberry hydro-alcoholic extract, SAE: Strawberry alcohol extract, PPAR-γ: Peroxisome Proliferator-Activated Receptor-γ, SREBP: Sterol Regulatory Element-Binding Proteins, NF-κβ: Nuclear Factor-κβ.


