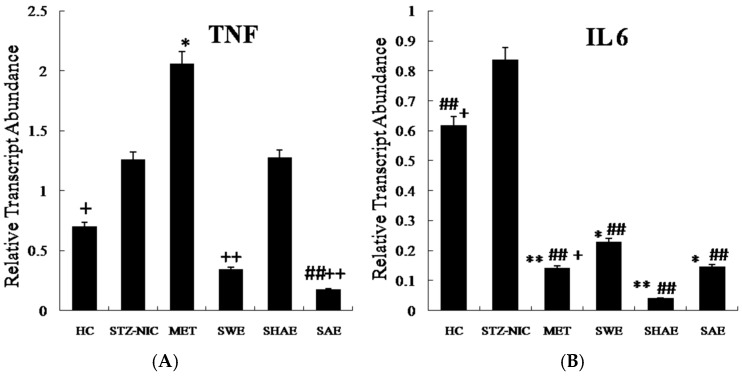
Figure 3.
Expression profile of inflammatory markers from the liver. Animals from the SWE, SHAE, and SAE groups were treated daily with corresponding extracts at a dose of 2 g/kg body weight (Per os). A and B are expression profiles of the TNF-α and Interleukin 6 genes, respectively. The total RNA was isolated from the animals’ livers and cDNA was prepared. The cDNA was analyzed for the modulation of inflammatory markers of fatty acid metabolism genes. Results are represented as mean ± SE (n = 3 for each group and the reactions were performed in duplicate). Comparisons between the control group and each individual group were performed by Dunnett’s multiple comparison test. (* p ≤ 0.05, ** p ≤ 0.01, when compared with the healthy control group; ## p ≤ 0.01, when compared with the NIC-STZ control group; + p ≤ 0.05, ++ p ≤ 0.01, when compared with the MET-treated control group). HC: Healthy control, NIC-STZ: NIC-STZ treated control, MET: Metformin-treated control, SWE: Strawberry aqueous extract, SHAE: Strawberry hydro-alcoholic extract, SAE: Strawberry alcohol extract, TNF-α: Tumor Necrosis Factor-α, IL6: Interleukin 6.

