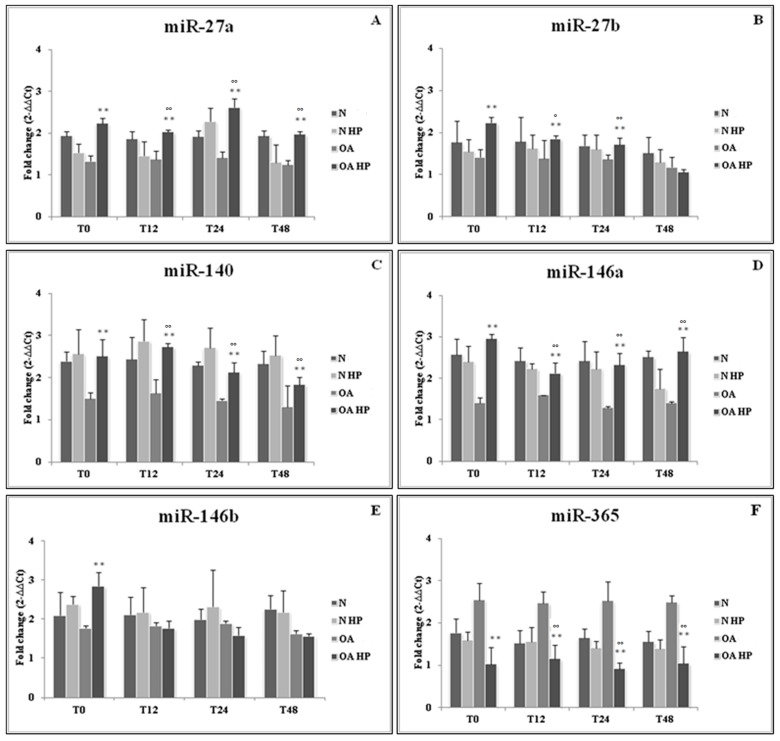
Figure 2.
Effect of hydrostatic pressure (HP) exposure immediately after pressurization (T0), and after 12 (T12), 24 (T24), and 48 (T48) h, on the expression levels of miR-27a (A), miR-27b (B), miR-140 (C), miR-146a (D), miR-146b (E), and miR-365 (F) in normal (N) and osteoarthritic (OA) chondrocytes. N = normal cells with no HP exposure; N HP = normal cells subjected to HP; OA = OA cells with no HP exposure; OA HP = OA cells subjected to HP. Data were expressed as mean ± standard deviation of triplicate values. ** p < 0.01 OA HP vs. OA T0; ° p < 0.05, °° p < 0.01 OA HP vs. OA.

