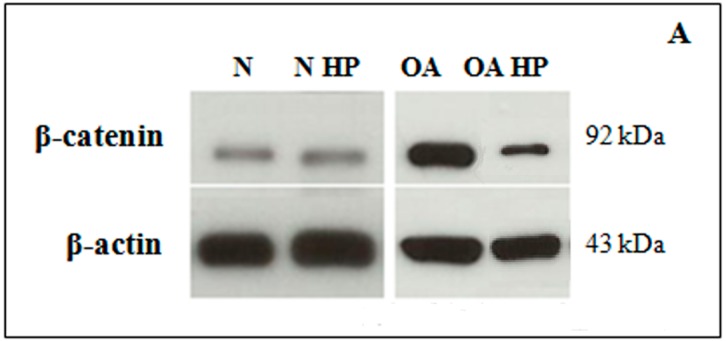
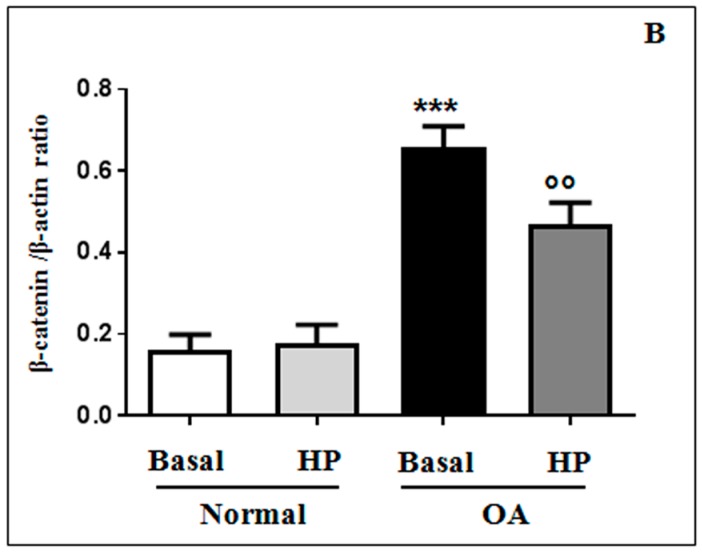
Figure 4.
Westernblot of β-catenin. Representative immunoblotting images (A) and densitometric analysis (B) of β-catenin protein levels in human normal and OA chondrocytes evaluated at basal condition and immediately after the application of a HP (3 h). β-actin was used as an internal control. Data were expressed as mean ± standard deviation of three independent experiments. *** p < 0.001 OA chondrocytes vs. normal chondrocytes. °° p < 0.01 OA HP vs. OA basal conditions.


