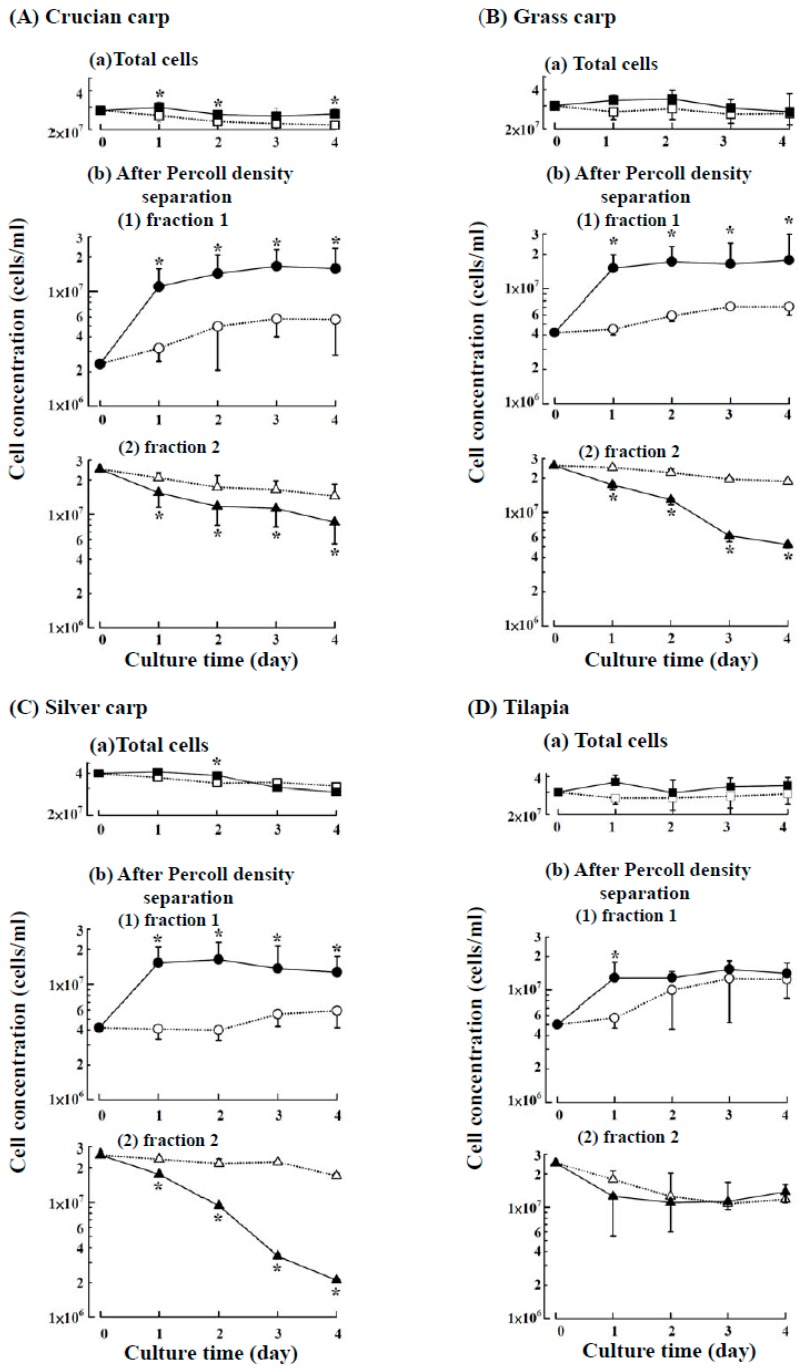
Figure 1.
Suspension cultures of head kidney cells from the four fish species with or without ZnCl2 supplementation. (A) Crucian carp; (B) grass carp; (C) silver carp; and (D) tilapia. All cells remained in suspension for four days. The growth curve of the total cells is shown in (a). The total cells were further separated by Percoll density centrifugation into fractions 1 and 2 (p = 1.020 and 1.070 g/mL), and the growth curves are shown in b(1) and b(2), respectively. Filled symbols and continuous lines represent cultures supplemented with ZnCl2; open symbols and broken lines represent cultures without ZnCl2. The data are expressed as the means ± SDs of four independent experiments. * Statistically significant differences with p < 0.05 between the groups supplemented with or without ZnCl2.

