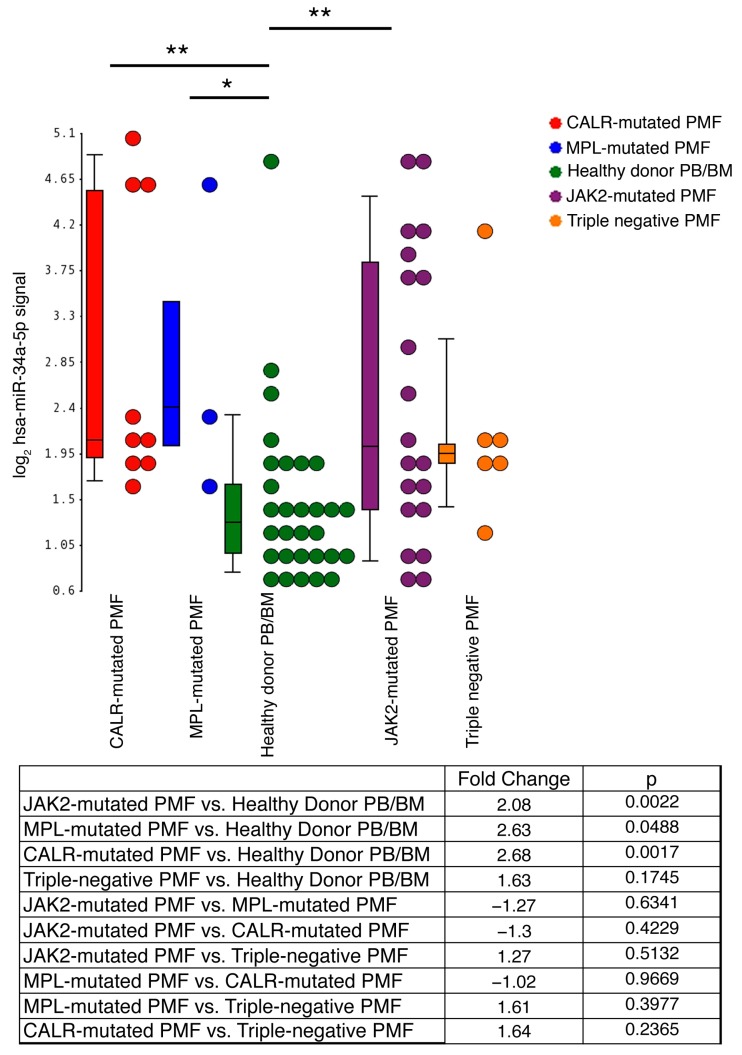
Figure 1.
Expression levels of miR-34a-5p in CD34+ cells from primary myelofibrosis (PMF) patients and healthy donors (HDs). Gene expression levels were measured by microarray analysis performed by Affymetrix platform as detailed in Materials and Methods Section 4.2. miR-34a-5p expression levels are reported as Robust Multiarray Analysis (RMA)-normalized log2 signals, which were obtained by using the Partek® Genomics Suite® software, version 6.6 Copyright©, 2016 (Partek Inc., St. Louis, MO, USA; http://www.partek.com). Boxes represent the interquartile range that contains 50% of the subjects, the horizontal line in the box marks the median, and bars show the range of values. Data are representative of 38 PMF and 30 HD samples (14 from bone marrow and 16 from peripheral blood). PMF samples are classified into JAK2-mutated (n = 20), MPL-mutated (n = 3), CALR-mutated (n = 9) and triple-negative (n = 6), based on the mutational status. The table at the bottom of the figure displays the results (Fold Change and p-value) for the comparative analysis of JAK2-mutated, MPL-mutated, CALR-mutated and triple negative PMF subgroups with the healthy donor-derived samples. Abbreviations: PMF, primary myelofibrosis; PB, peripheral blood, BM, bone marrow; n = number of samples. * p < 0.05; ** p < 0.01.

