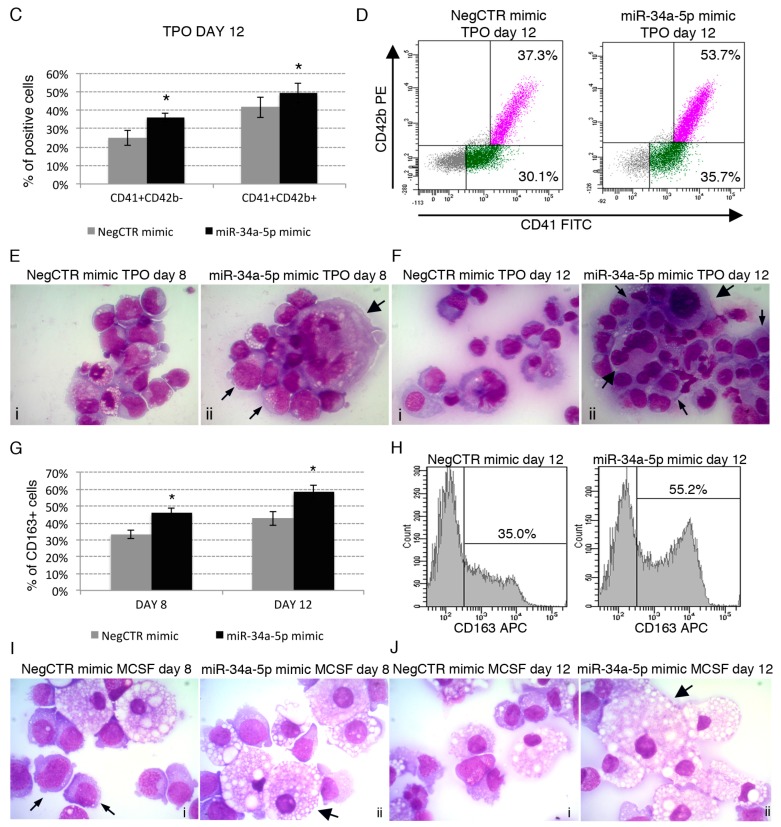
Figure 3.
Effects of miR-34a-5p overexpression on megakaryocyte and macrophage differentiation. (A–C) Flow cytometric analysis (mean ± SEM; n = 3) of CD41 and CD42b expression at day 4 (A); day 8 (B) and day 12 (C) of TPO-driven megakaryocyte unilineage culture post-nucleofection; (D) Representative dot plots for the flow cytometric detection of CD41 and CD42b differentiation markers at day 12 of megakaryocyte unilineage culture post-nucleofection; (E,F) Morphological analysis of NegCTR mimic (i) and miR-34a-5p mimic-transfected cells (ii) after May–Grunwald–Giemsa staining at day 8 (E) and day 12 (F) of megakaryocyte unilineage culture post-nucleofection in a representative experiment. Thick arrows indicate large megakaryocytes with polyploid nuclei; thin arrows indicate cells with a granular cytoplasm, which is a feature of megakaryocyte maturation. Magnification, ×1000; (G) Flow cytometric detection (mean ± SEM; n = 3) of the CD163 marker at day 8 and day 12 of monocyte/macrophage unilineage culture post-nucleofection; (H) Representative histograms for the flow cytometric detection of CD163 marker at day 12 of MCSF-driven monocyte/macrophage unilineage culture post-nucleofection; (I,J) Morphological analysis of NegCTR mimic (i) and miR-34a-5p mimic-transfected cells (ii) after May–Grunwald–Giemsa staining at day 8 (I) and day 12 (J) of monocyte/macrophage unilineage culture post-nucleofection in a representative experiment. Thick arrows indicate macrophages; thin arrows indicate monocytes. Magnification, ×1000. Three independent experiments (indicated by n = 3) were performed with different healthy donor-derived cord blood units. * p ≤ 0.05 in miR-34a-5p mimic compared to NegCTR mimic sample. Abbreviations: TPO, thrombopoietin; MCSF, monocyte colony-stimulating factor.


