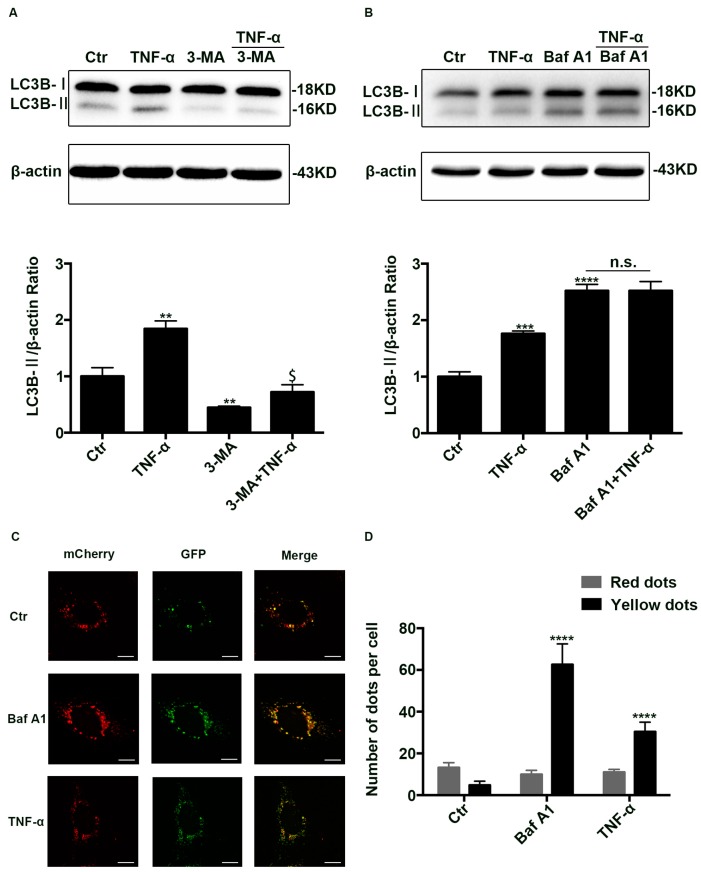
Figure 2.
The inhibition of autophagic degradation in TNF-α treated cells. (A,B) Western blotting analysis of LC3B-II in Caco-2 cells treated with TNF-α (10 ng/mL) in the presence or absence of 3-MA (5 mM, 24 h) or Baf A1 (100 nM, 4 h) pretreatment. (C) Representative images of Caco-2 cells transfected with ad-mCherry-GFP-LC3B adenovirus after TNF-α (10 ng/mL, 48 h) or Baf A1 treatment (100 nM, 4 h). Scale bar: 15 μm. (D) The number of red and yellow LC3 dots per cell were counted under confocal microscope (>30 cells/group). Data were shown as mean ± SD and replicated three times. ** p < 0.01, *** p < 0.001, **** p < 0.0001 versus control group. $ p < 0.05 versus 3-MA group. n.s., no significant. Ctr, control group; 3-MA, 3-methyladenine; Baf A1, Bafilomycin A1.

