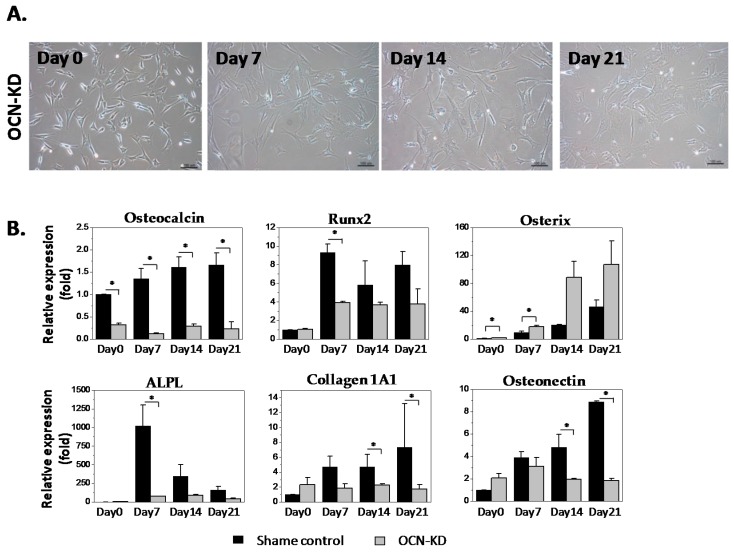
Figure 2.
(A) Photomicrograph of osteocalcin-knockdown (OCN-KD) cultured on quartz coverslips in osteogenic induction medium at day 0, 7, 14, and 21. Scale bar: 100 μm. The halo regions surrounding cell edges of MSCs are the artifacts due to phase contrast microscope; (B) the gene expression of Sham and OCN-KD groups. Data are shown as mean ± SD (n = 3). Student’s t-test was used for two group analysis with significant difference indicated by asterisks (* p < 0.05).

