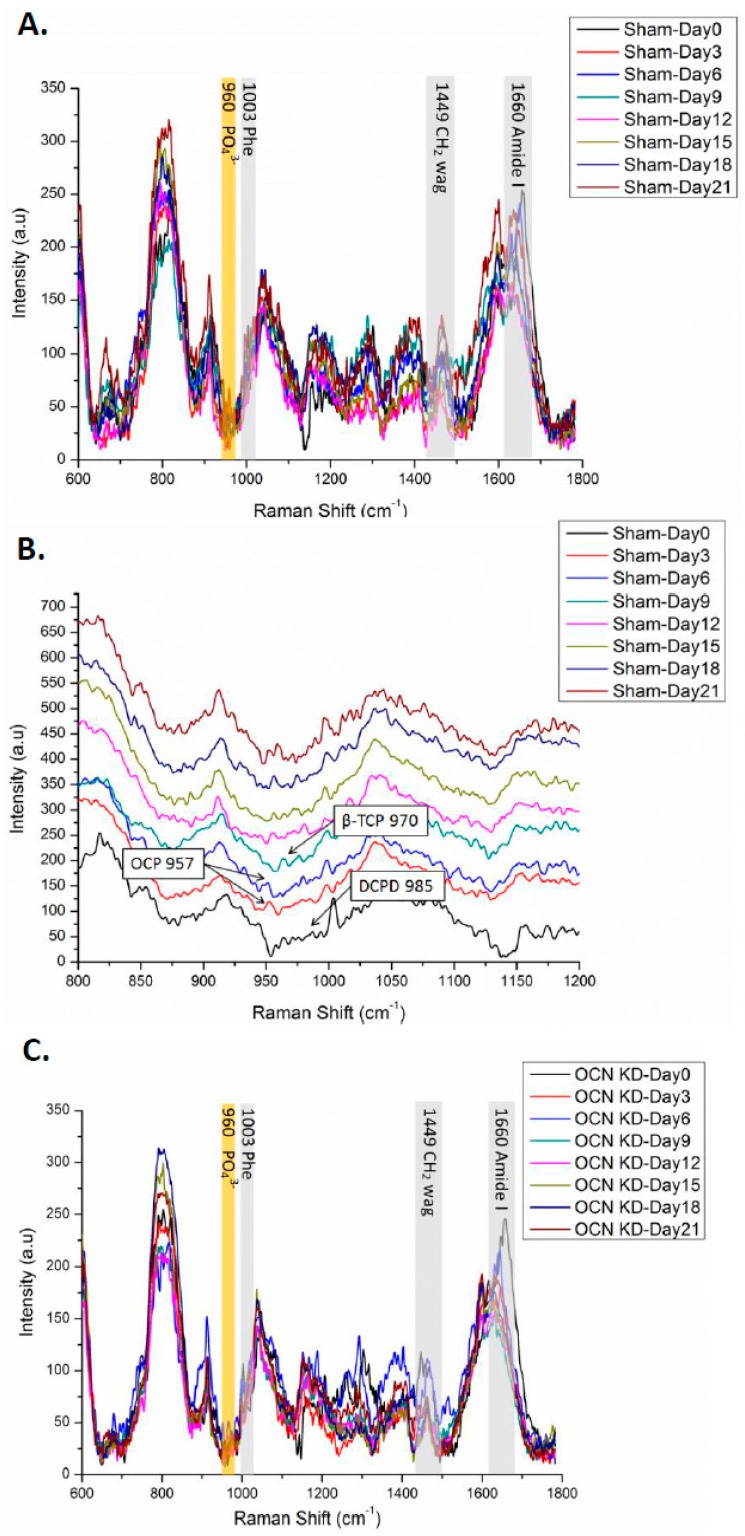
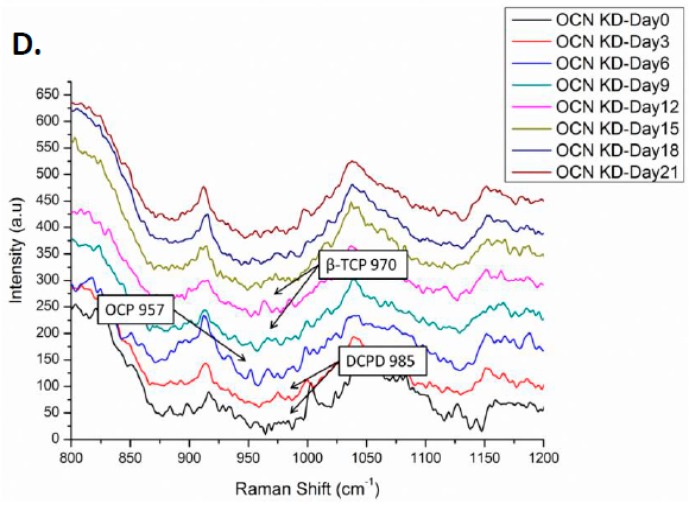
Figure 4.
(A,B) Raman spectra of the sham control group during osteogenic differentiation: (A) complete view from 600 to 1800 cm−1; (B) the detail region from 800 to 1200 cm−1 in stack diagram; (C,D) Raman spectra of the OCN-KD group; (C) complete view from 600 to 1800 cm−1; (D) the detail region from 800 to 1200 cm−1 in stack diagram.


