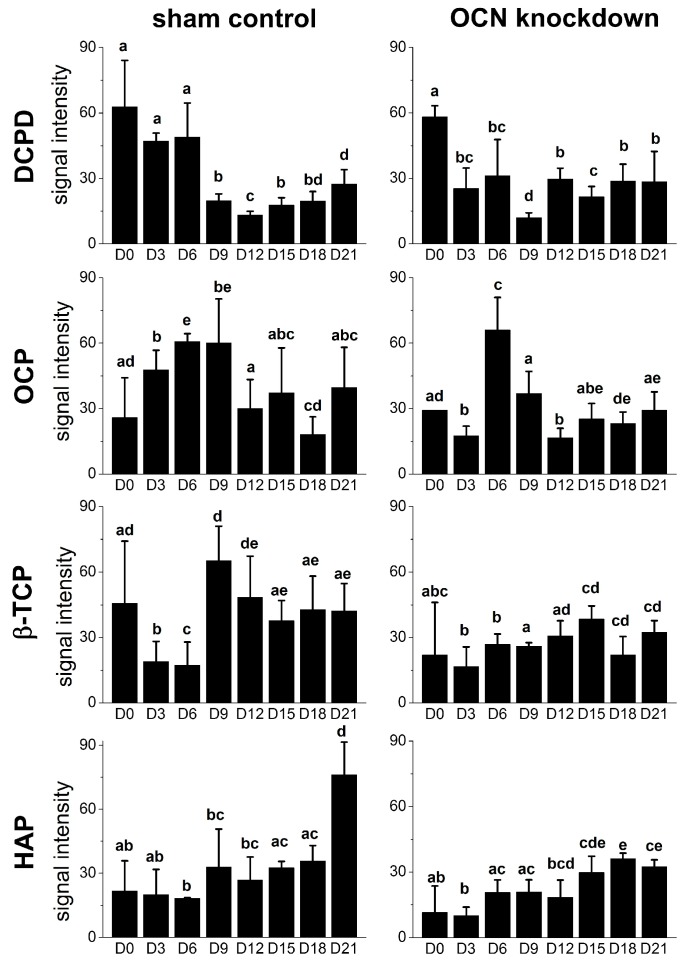
Figure 5.
The intensities of peaks of mineral species signals dicalcium phosphate dehydrate (DCPD) at 985 cm−1, octacalcium phosphate (OCP) at 957 cm−1, β-tricalcium phosphate (β-TCP) at 970 cm−1, and hydroxyapatite (HAP) at 960 cm−1 along the time course of osteogenic differentiation. Spectra were collected on day 0, 3, 6, 9, 12, 15, 18, and 21 after the induction. Data are shown as mean ± SD. One-way analysis of variance (ANOVA) followed by running Tukey’s post-hoc tests was performed for multiple comparisons. Different letters represent significant differences between groups. For example, a and b represent significant difference, a and bc represent significant difference, whereas ab and bcd do not. A p value less than 0.05 is defined as statistically significant; D = Day.

