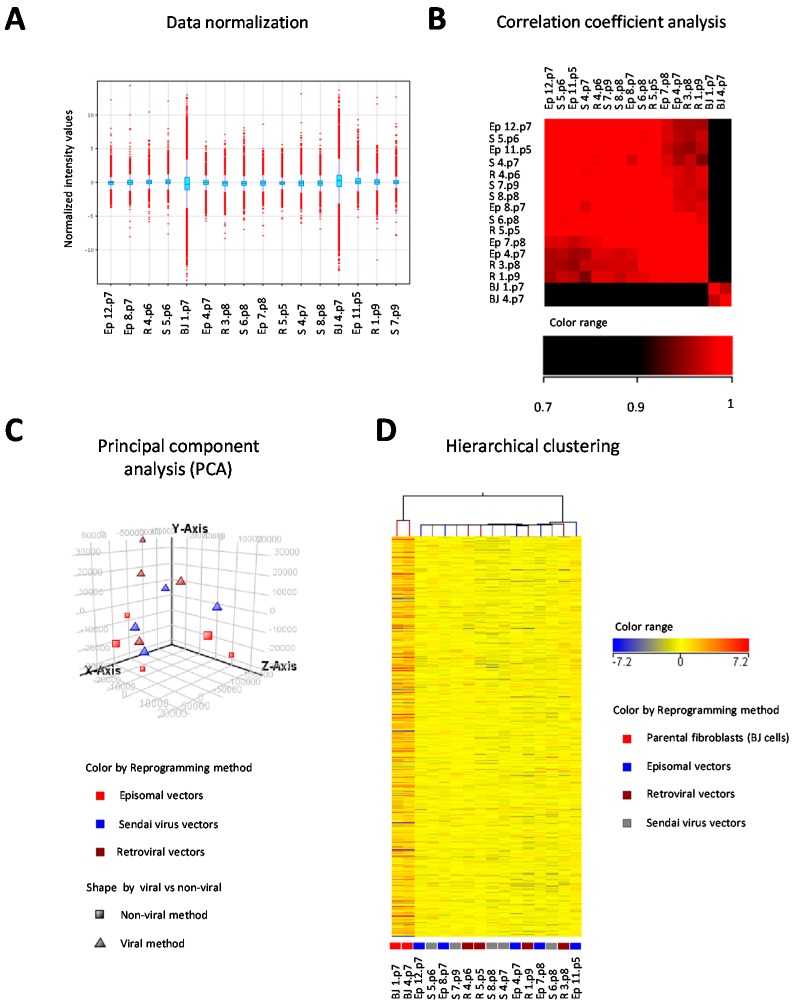
Figure 4.
Global gene expression profile analysis by DNA microarrays of 14 human induced pluripotent stem cell (hiPSCs) lines reprogrammed with three different strategies, i.e., retroviral vectors (R), Sendai virus vectors (S) and episomal vectors (Ep), and parental BJ fibroblasts. (A) Distribution of normalized intensity values of each sample to the median of all samples is displayed in the box-whisker plot; thresholded to 1, shifted to 75.0 percentile; probes with intensity values beyond 1.5 times the interquartile range are shown in red; (B) correlation coefficient analysis of datasets; (C) principal component analysis (PCA) of datasets according to reprogramming methods and type of vectors (viral vs. non-viral); (D) unsupervised hierarchical clustering of samples according to intensity values and reprogramming protocols. A total of 41,093 entities was included in the analysis.

