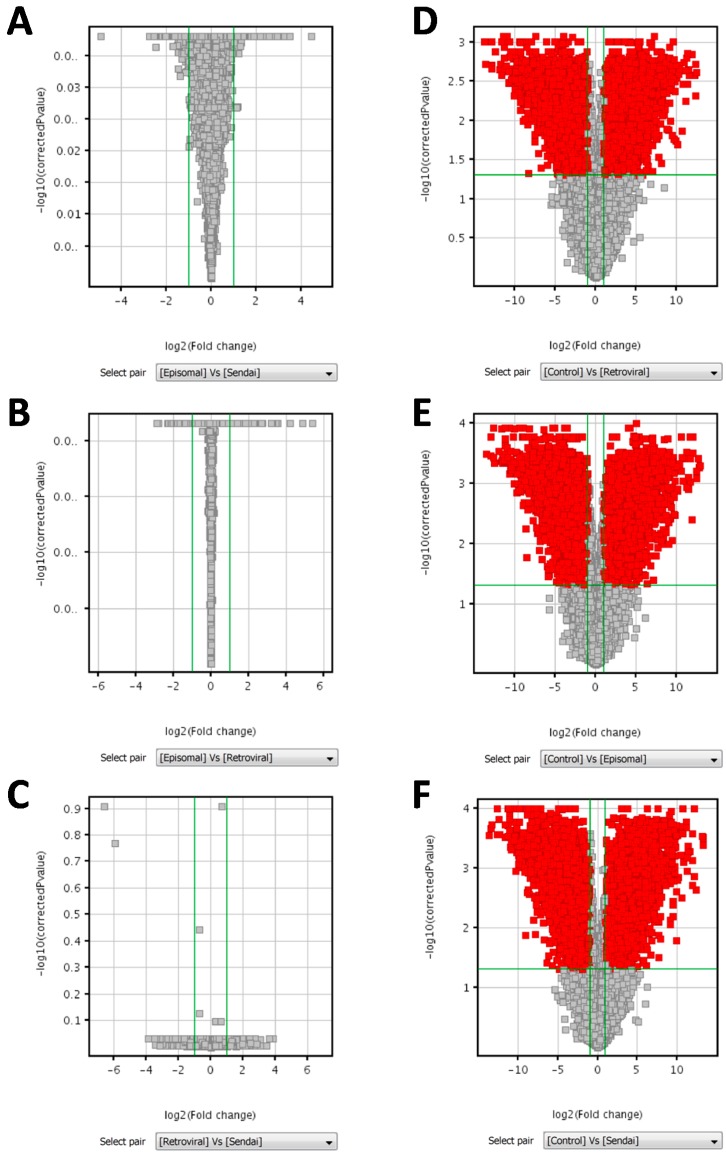
Figure 5.
Volcano plots of pairwise comparisons between reprogramming methods and between hiPSC clones and parental BJ fibroblasts (Control). Groups were compared by unpaired Student’s t-test followed by Benjamini Hochberg false discovery rate (FDR) for multiple testing correction. Volcano plots of pairwise comparisons between hiPSC clones obtained by episomal vectors vs. Sendai virus vectors (A); episomal vectors vs. retroviral vectors (B); and retroviral vectors vs. Sendai virus vectors (C) displaying 0 entities out of 41,093, satisfying the p-value cut-off 0.05 and the fold change cut-off 2.0. Volcano plots of pairwise comparisons between hiPSC clones obtained by retroviral vectors (D); episomal vectors (E); and Sendai virus vectors (F) vs. parental BJ fibroblasts (Control) displaying, respectively, 11,191 entities, 12,230 entities, and 13,003 entities out of 41,093, satisfying the p-value cut-off 0.05 and the fold change cut-off 2.0. Green lines represent applied cut-off of Fold change (vertically) and of corrected p-value (horizontally). Red dots represent genes that were significantly up or down-regulated.

