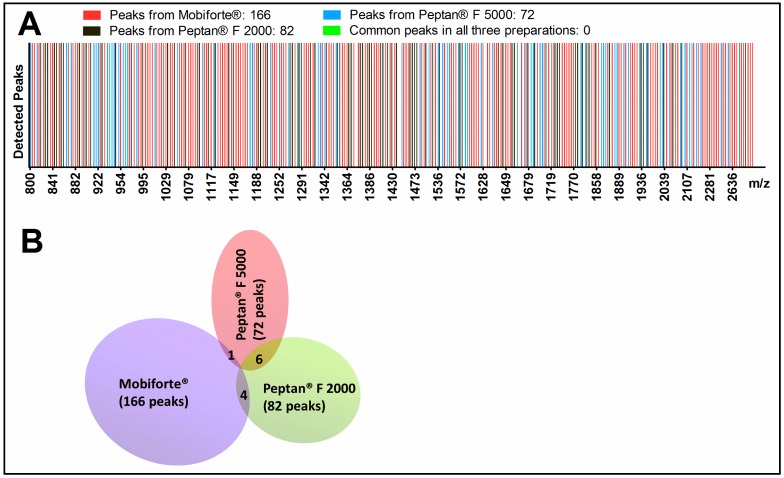
Figure 1.
Mass spectra from CHs by MALDI-TOF-MS. Representation of mass spectra from Mobiforte®, Peptan® F 5000 and Peptan® F 2000 as a (A) gel-like view; and (B) Venn diagram. MALDI-TOF-MS analysis was performed in reflector mode with a mass-to-charge ratio (m/z) range between 500 and 4000 m/z using mass gates. The numbers in brackets are the number of total peaks each representing a peptide of each CH. The numbers in the intersections of the Venn diagram are peptides shared by both preparations. No common peptide was identified in all three CHs.

