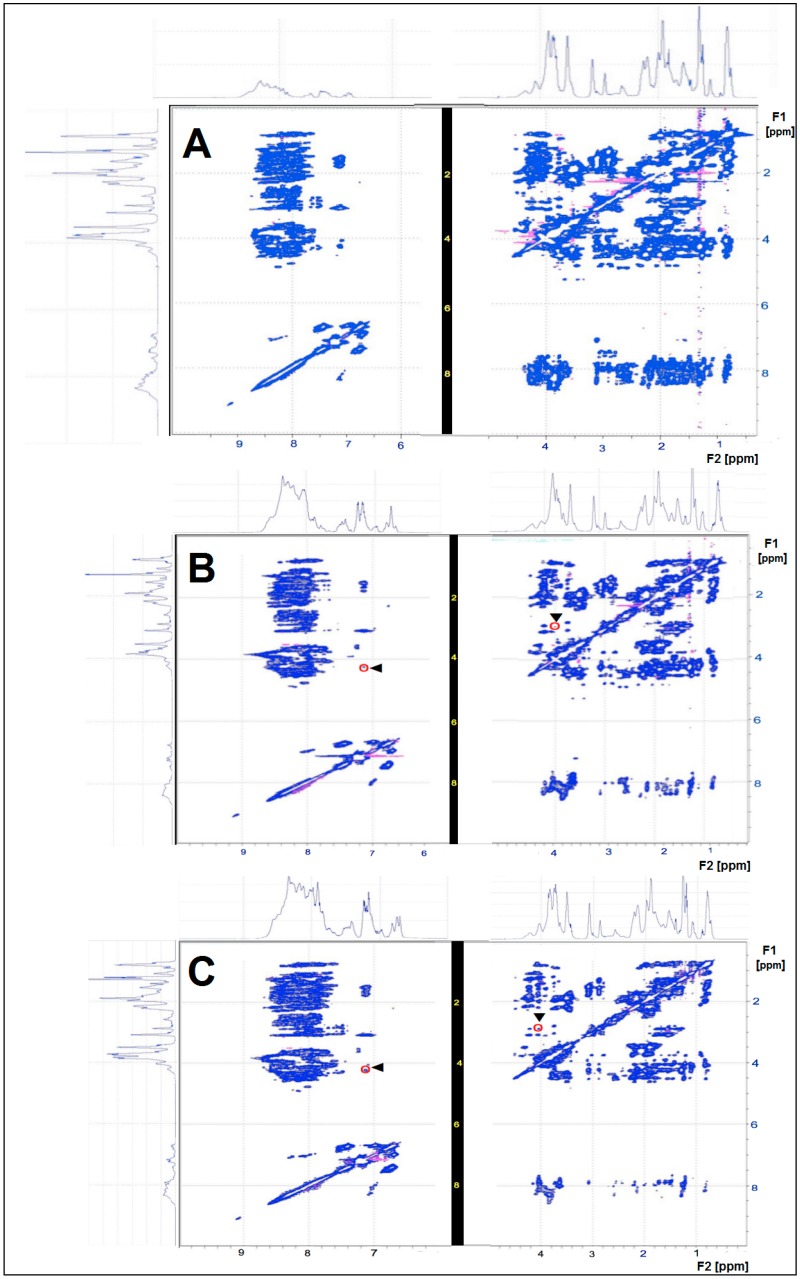
Figure 2.
NMR-TOCSY spectra of the three CHs tested. The TOCSY spectra show characteristic signal alterations that can be used to discriminate the three CHs: (A) Mobiforte®; (B) Peptan® F 5000; and (C) Peptan® F 2000. Two cross peaks (at 4.3/7.4 ppm and at 3.0/4.0 ppm) in the TOCSY spectra of Peptan® F 5000 and Peptan® F 2000 are highlighted by an arrowhead and red circle. Cross peaks are all signal spots that occur below and above the diagonal line that represents the basic one-dimensional spectrum. The cross peaks below and above the diagonal line occur symmetrically and indicate which protons are coupled, based on their F1 and F2 ppm values.

