Figure 5.
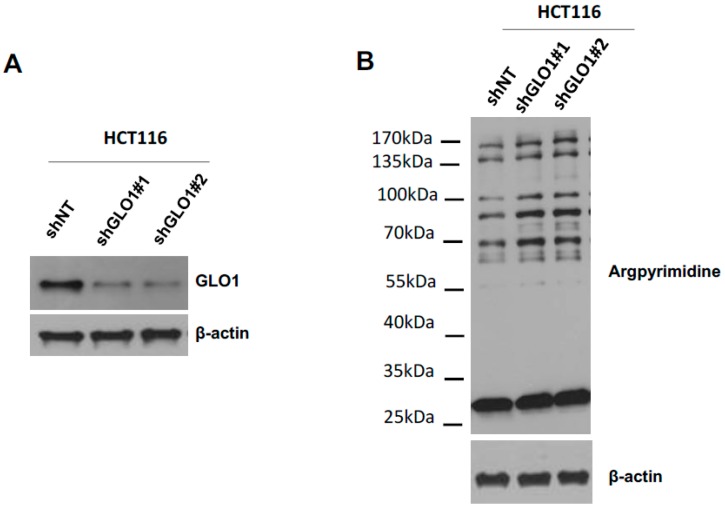
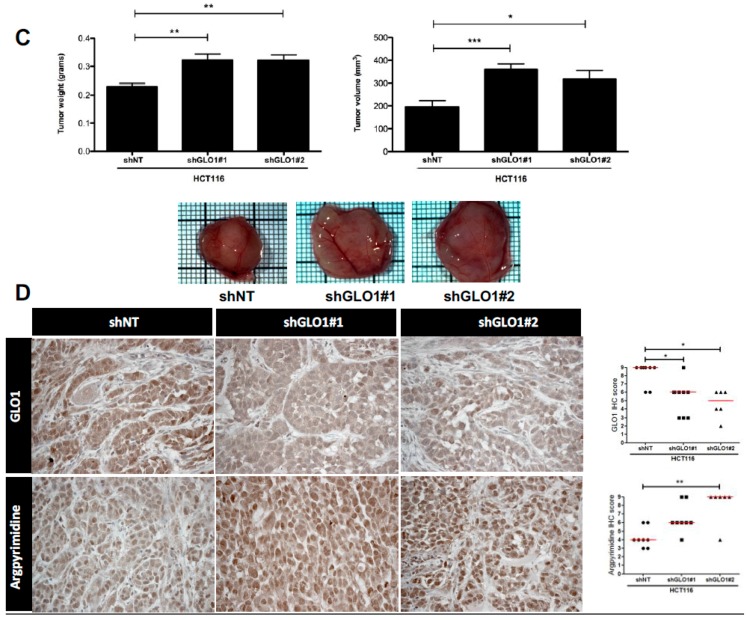
GLO1 depletion favors colorectal cancer cell growth in vivo. (A) The efficiency of GLO1 knockdown in HCT116 cells was validated by Western blot analysis; (B) Increased argpyrimidine level has been observed in GLO1 depleted cells compared with shNT control cells using Western blot analysis. β-Actin is shown as loading control; (C) Effect of GLO1 silencing on HCT116-derived tumor growth in chorioallantoic membrane (CAM) tumor model. The weight (left) and volume (right) of CAM experimental tumors collected at Day 7 is shown (at least 6 eggs/group). Data are shown as mean values ± SEM. Representative macroscopic tumor appearance is shown for each condition according to CAM experiment details are described in Material and Methods; (D) Representative GLO1 expression and argpyrimidine levels in CAM experimental tumors (400× magnification). IHC scoring for each is shown in panels on the right. Each dot represents one case and bars represent median. Statistical analysis has been performed using Bonferroni Multiple Comparison Test, * p < 0.05, ** p < 0.01, *** p < 0.001.


