Figure 4.
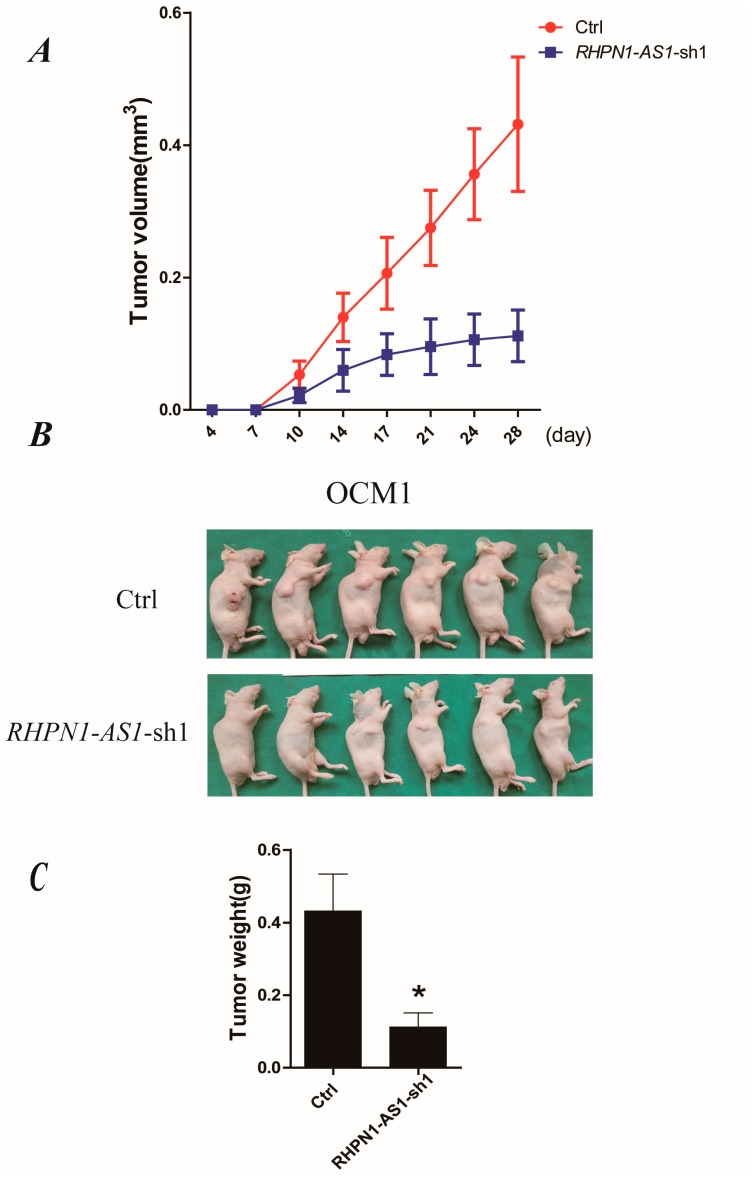
Depressed expression of RHPN1-AS1 repressed UM cell growth in vivo. (A) Tumor volume growth curves. Each data point represents the mean ± SD; (B) RHPN1-AS1 knockdown OCM1 and control cells were injected into nude mice subcutaneously. Representative images of tumor growth 28 days after subcutaneous injection; (C) Mean tumor weights four weeks after inoculation. * p < 0.05.

