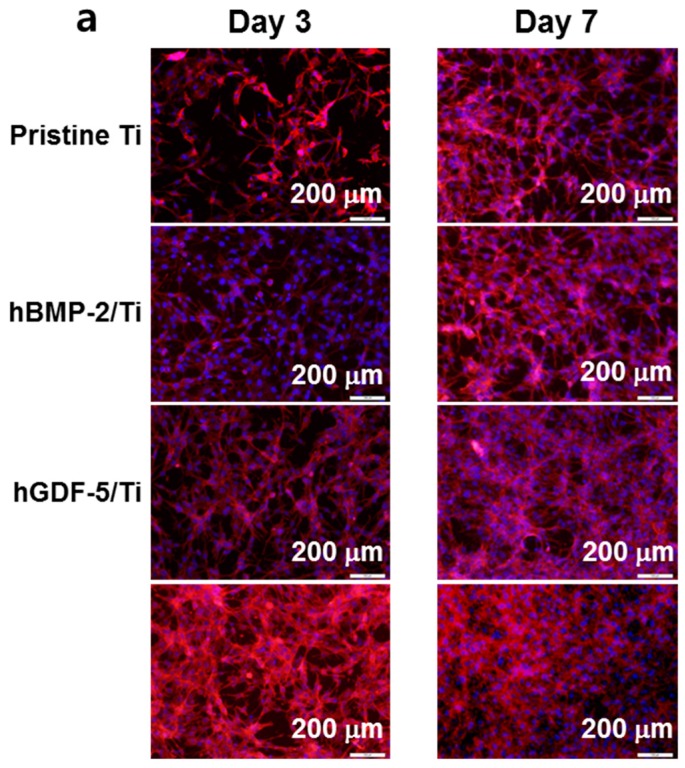
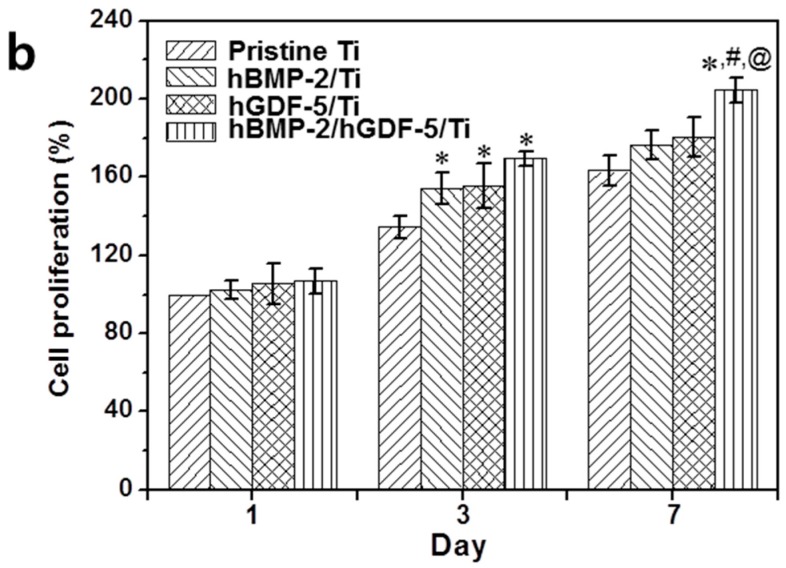
Figure 5.
(a) Fluorescence microscope images (200×) and (b) in vitro cell proliferation rates of MC3T3-E1 cells cultured on pristine Ti, hBMP-2/Ti, hGDF-5/Ti, and hBMP-2/hGDF-5/Ti samples for 1, 3, and 7 days of culture, as compared to that of MC3T3-E1 cells cultured on culture plates (control). F-actin stain was carried out with phalloidin-Alexa Fluor 555. The error bars represent mean ± SD (n = 3). These experiments were repeated three times (* p < 0.05, # p < 0.05 and @ p < 0.05). Controls of * the p-values were pristine Ti, hBMP-2/Ti, and hGDF-5/Ti, respectively.


