
Figure 3.
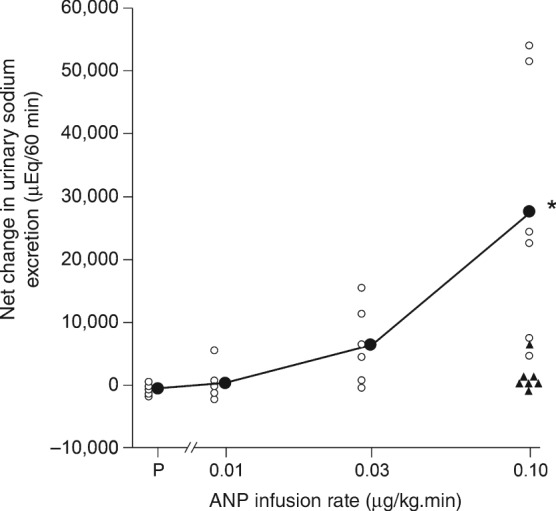
Net change in urinary sodium excretion in response to infusion of atrial natriuretic peptide (ANP) or placebo (P) in seven patients with chronic heart failure (CHF) and seven healthy controls. Open and closed circles indicate individual and mean values, respectively, for controls. Asterisk indicates that the mean value with the highest dose of ANP was higher (P < 0.05) than with P. Triangles indicate individual values for CHF patients with the highest dose of ANP.(Reproduced from Cody et al. 11 with permission.)