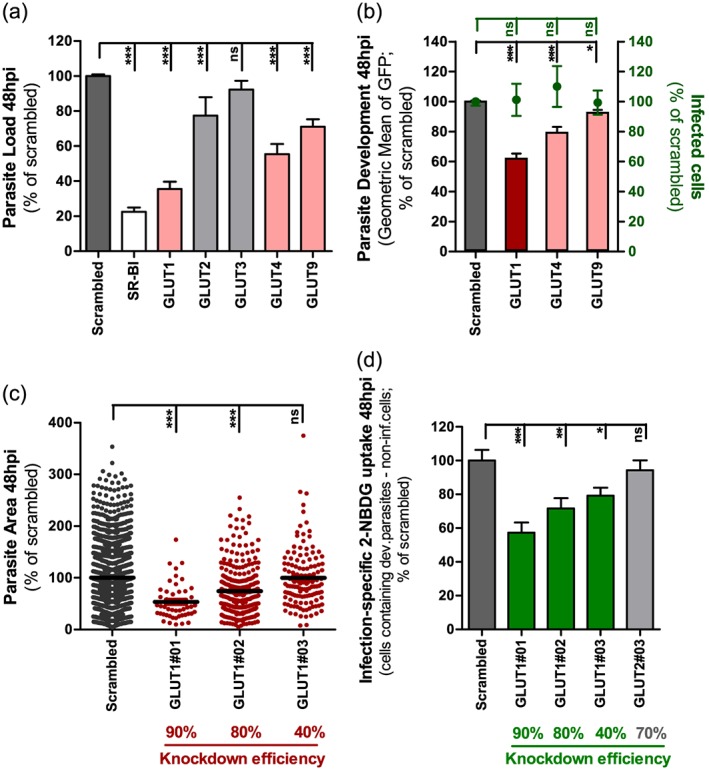
Figure 3.

GLUT1 knockdown significantly impairs P. berghei liver stage development and glucose uptake by P. berghei‐infected cells. A. Huh7 cells with stable knockdown of one of five GLUT receptors were infected with luciferase‐expressing P. berghei sporozoites and parasite load was assessed by luminescence measurement 48 h later. A scrambled shRNA sequence was used as a negative control and a cell line with stable knockdown of SR‐BI as positive control. Pool of four independent experiments. Error bars represent SEM. B. Huh7 cells with the knockdown of GLUT1, GLUT4 or GLUT9 were infected with green fluorescent protein (GFP)‐expressing P. berghei sporozoites. The percentage of infected cells and parasite development were assessed by flow cytometry at 48 hpi. Pool of three independent experiments. Error bars represent SEM. C. Quantification of the area of the EEFs in each of the three different cell lines with GLUT1 knockdown at 48 hpi by immunofluorescence microscopy. The knockdown efficiency of each shRNA sequence is indicated. Pool of three independent experiments. D. Difference of 2‐NBDG uptake in the several cell lines with GLUT1 knockdown by developing parasites‐containing cells and non‐infected cells at 48 hpi, assessed by flow cytometry. A cell line with the knockdown of GLUT2 was used as control. Pool of four independent experiments. Error bars represent SEM. All panels: one‐way analysis of variance (ANOVA) with post‐test Dunnett. ns, not significant, * P < 0.05, ** P < 0.01 and *** P < 0.001.
