
Figure 2.
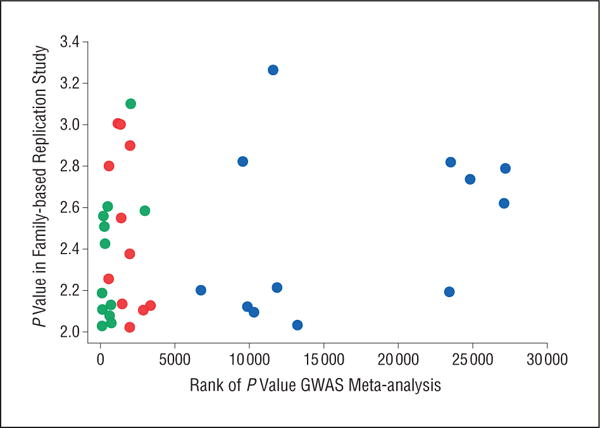
Comparison of single-nucleotide polymorphisms selected through data integration (blue), that have a top genome-wide association study (GWAS) meta-analysis P value (red), or both (green). P values in the family-based replication study are calculated on a −log10 scale.