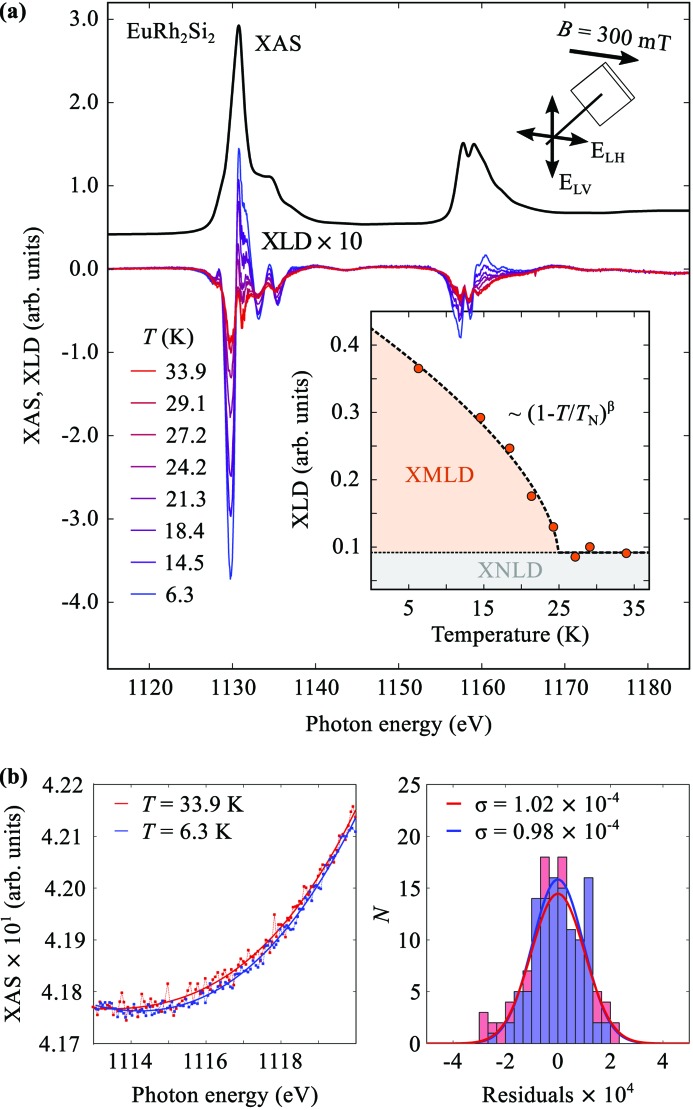
Figure 8.
(a) X-ray linear dichroism at the Eu M 4,5-edges of EuRh2Si2 as a function of temperature. (b) XAS data in the pre-edge region together with a smoothing spline through the data for T = 6.3 K (heater off) and T = 33.9 K (heater on). The right-hand panel shows a histogram of the distribution of the residuals together with the the best fit to a Gaussian for each temperature.

