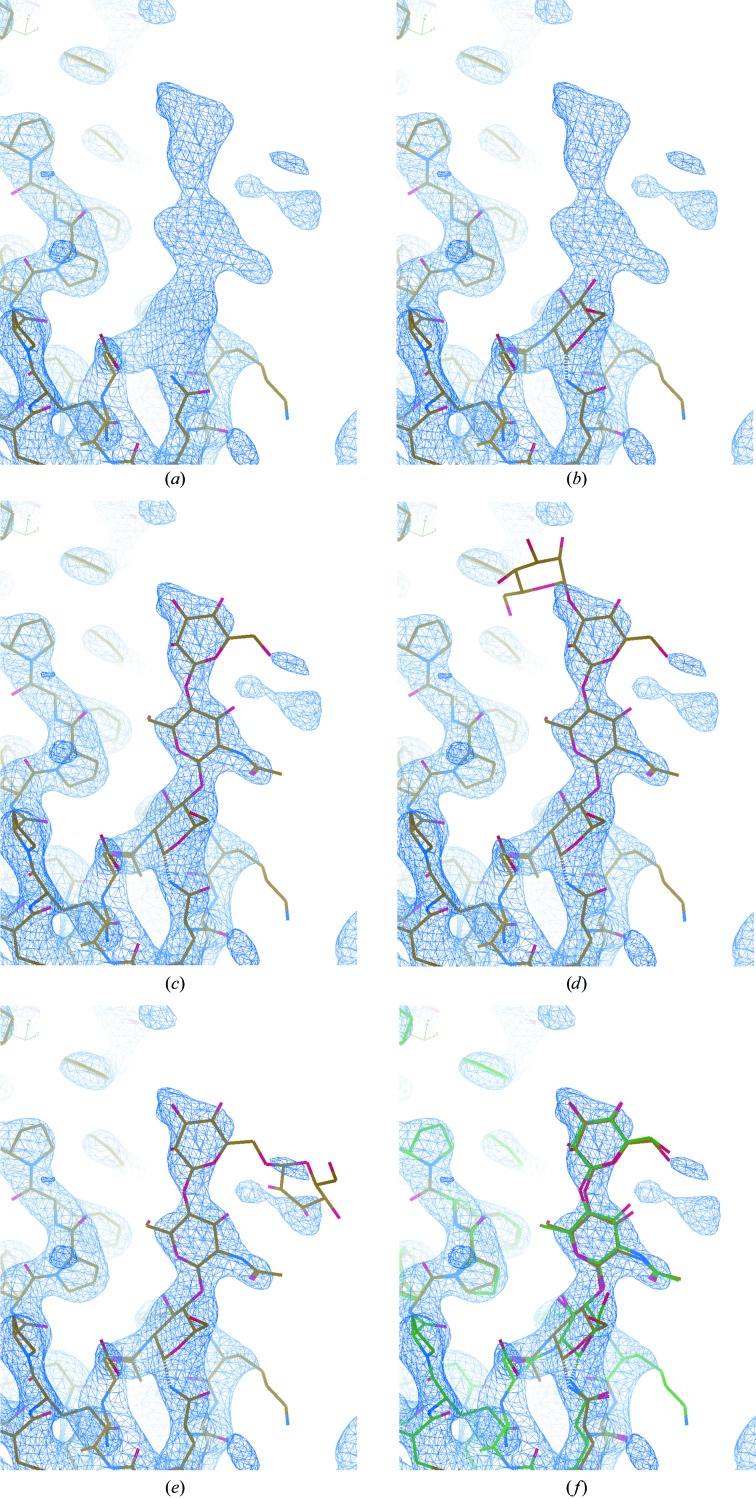
Figure 6.
Automatically building an oligosaccharide into a low-resolution map using LO/Carb. (a) focuses on the glycosylation site of a structure refined using data extending to 3.3 Å resolution (PDB entry 4n4z; Gati et al., 2014 ▸) after removing the carbohydrate structure. The current model is shown along with the 2mF o − DF c density map, using the default contour level in Coot (0.34). Selecting ‘Add Oligomannose’ from the ‘Glyco’ menu (which is activated by selecting ‘Carbohydrate’ from the ‘Modules’ section in the ‘Extensions’ menu) results in Coot attempting to automatically build as much of the carbohydrate structure as possible. The sugar linked to the protein is built first (b), followed by additional sugars one by one, until the whole structure is built (c). Attempts to build additional sugars in chemically reasonable positions are made, but are rejected if there is insufficient density to support the model (d, e). (f) shows the final automatically built model (yellow) next to the original deposited model (green).

