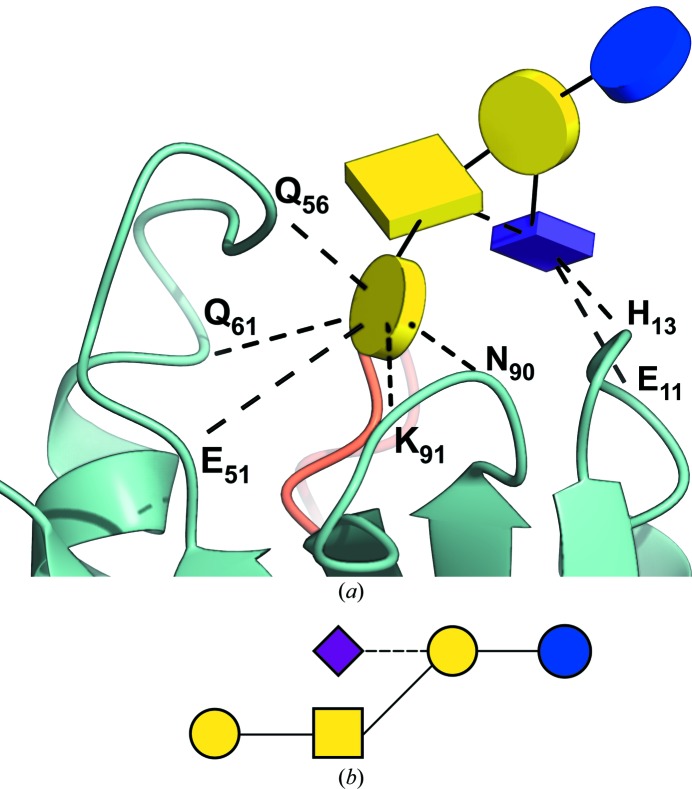
Figure 7.
Visualizing ligand glycans. (a) A simplified three-dimensional view of the interactions between the GM1 pentasaccharide and the subunit B5 of the choleratoxin pentamer (PDB code 3chb), reported in Merritt et al. (1994 ▸) and re-refined in Merritt et al. (1998 ▸). Only direct hydrogen bonds are shown, as waters have been omitted from the picture. The protein part has been coloured by chain. There is an unlabelled hydrogen bond between the GalNAc and Neu5Ac monosaccharides, also drawn as a dashed line. All the depicted interactions, computed on the fly by CCP4mg, match those manually determined in the original research (Merritt et al., 1994 ▸). (b) Two-dimensional representation by Privateer. The dashed line indicates an α-link.

