. 2016 Sep 12;8(1):680–688. doi: 10.1039/c6sc03500k

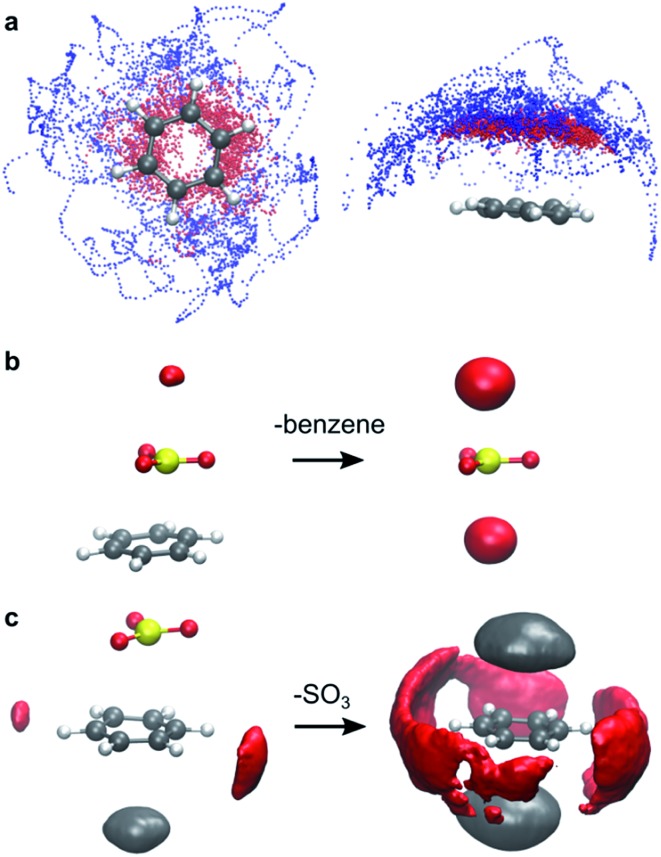
Fig. 3. Intermolecular interactions observed during AIMD simulations. (a) Benzene–SO3 interactions in gas phase. Superposition of snapshots of the benzene···SO3···SO3 complex in top view (left) and side view (right). Dots represent the S atom positions of the primary SO3 (red) and assisting SO3 (blue). (b) Specific SO3–CH3NO2 interactions. Probability isosurface (red) of CH3NO2 O atoms around the SO3 S atom in a benzene···SO3 complex (left) and in separated SO3 (right). (c) Specific benzene–CH3NO2 interactions. Probability isosurface of solvent O (red) and C (grey) atoms around benzene C atoms, in a benzene···SO3 complex (left) and in separated benzene (right). Deviations from symmetry in the isosurfaces are due to finite sampling.

Fig. 3